Slide 8 of 11 from Pixel Perspective PowerPoint Template
Bar Chart Analysis Slide for Pixel Perspective
Bar Chart Analysis Slide for Presentations
- Chart
- Bar Vertical
- Evaluation Slide
- 16:9
- 100% Editable
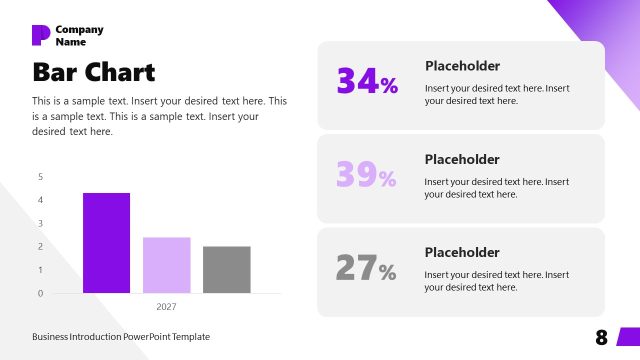
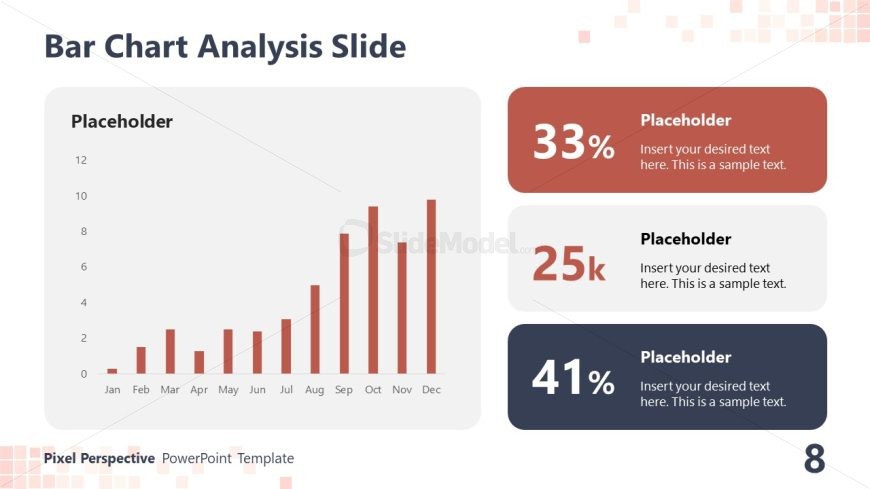
The Bar Chart Analysis Slide from the Pixel Perspective PowerPoint Template offers a clear layout for presenting sales analysis or project progress updates. This slide template features editable shapes and a vertical bar chart that visually represents monthly data, complemented by text placeholders for detailed insights. It suits business presentations requiring precise data evaluation within a professional slide deck.
What’s on This Slide
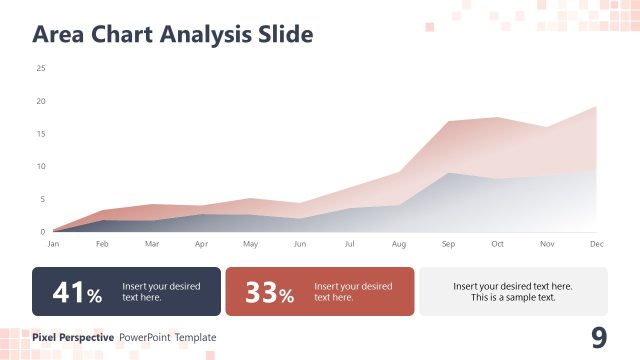
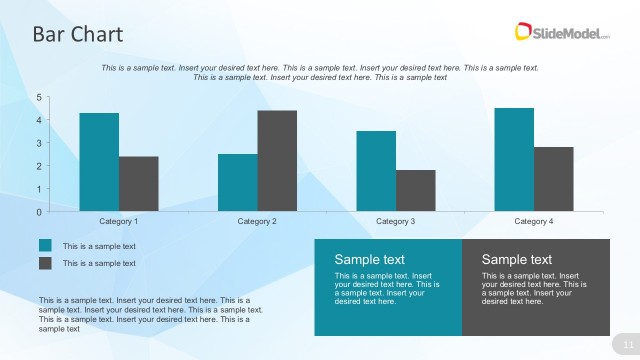
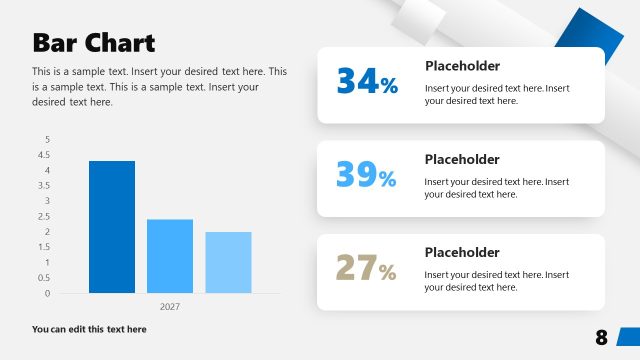
The slide features a bar chart positioned on the left, displaying data across months from January to December. The chart has vertical bars in varying heights, indicating values from 0 to 12. To the right, three text placeholders are arranged vertically, each with a distinct background color: red for the first, light gray for the second, and dark blue for the third. Each placeholder contains sample text indicating where to insert desired content. The overall layout is clean, with a title at the top and a footer at the bottom.
How to Use It
This layout serves as a data visualization tool, ideal for presenting quantitative analysis. It fits well in a sequence following introductory slides, providing a visual breakdown of performance metrics or project outcomes. Common scenarios include quarterly performance reviews, sales analysis, or project progress updates. The layout effectively communicates key data points while allowing for additional context in the placeholders.
Text Placeholders & Capacity
Keep your copy within these limits so it fits without resizing. Node body slots can accommodate about 10-12 words each.
| Placeholder | Count | Max characters (approx.) |
|---|---|---|
| Chart title | 1 | 30 |
| Item body | 3 | 50 |
| Footer | 1 | 40 |
Slide Keywords
Download unlimited PowerPoint templates, charts and graphics for your presentations with our annual plan.
DOWNLOADReturn to Pixel Perspective PowerPoint Template.