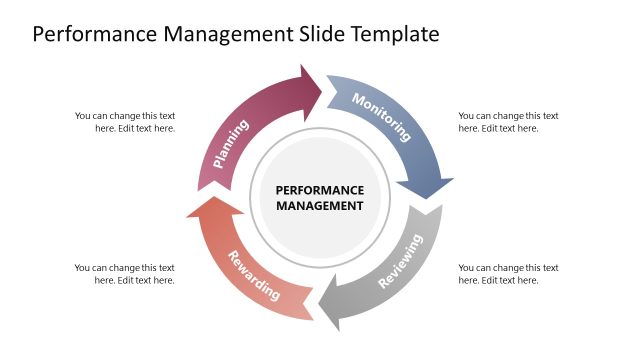
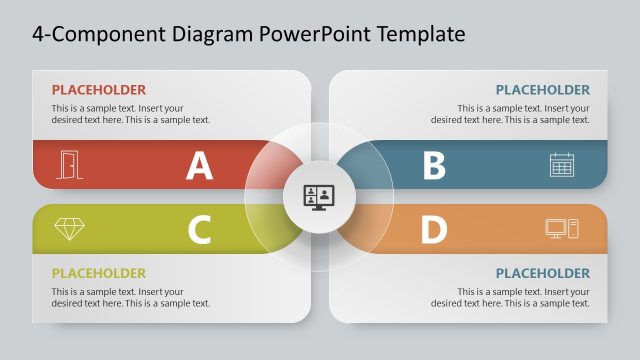
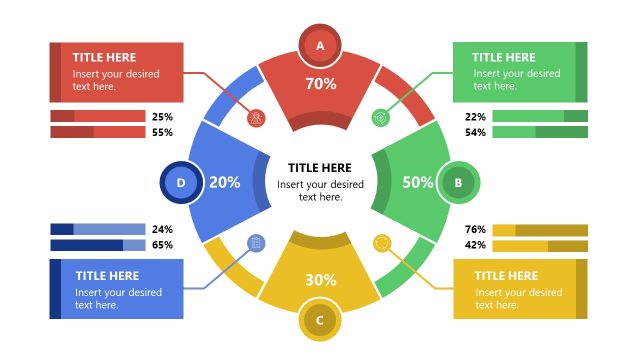
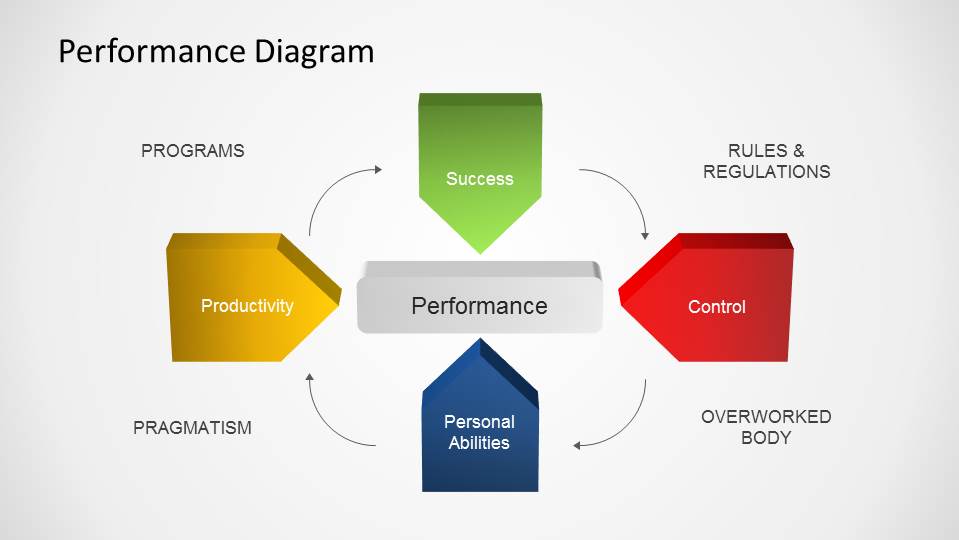
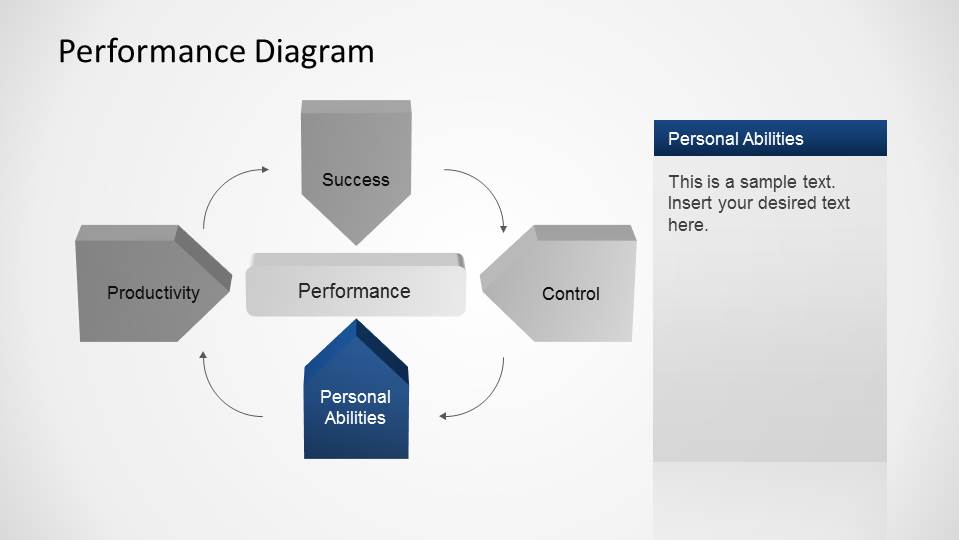
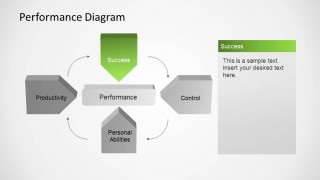
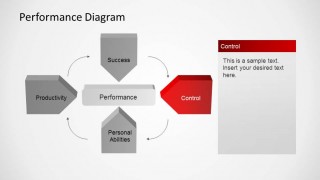
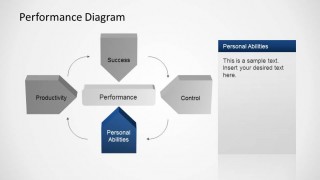
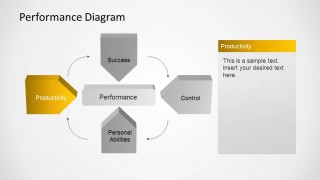
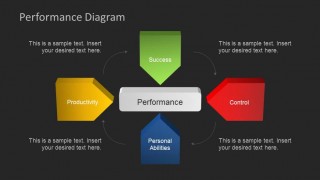
Performance PowerPoint Diagram is a simple 4 Steps Diagram with the performance indicators, Success, Control, Personal Abilities and Productivity. Each Indicator is created as a PowerPoint shape, and colored with a brilliant palette. In the center of the diagram, the Performance box is being pointed by the other 4 factors. There is one slide per performance indicator, and a dark background summary slide to close the lecture.
What’s inside this template
Example presentation scenarios
- A team leader can use the overview diagram to introduce how success, control, personal abilities, and productivity contribute to a shared performance goal.
- An HR trainer can use the single-indicator detail slides to teach one performance factor at a time while keeping the complete framework visible.
- A business consultant can use the dark summary slide to close a workshop by linking action items back to the four performance indicators.
- An operations manager can use the productivity and control detail slides to structure a discussion about process behavior, ownership, and work standards.
Features
- 100% editable presentation template
- Compatible with Microsoft PowerPoint
- 16:9 aspect ratio slides
- Scalable vector shapes, icons and illustrations
- AI-Ready for Microsoft Copilot and Claude
- Instant access and download
Frequently asked questions
Q: How should a presenter explain the four performance indicators without making the slide feel abstract?
A: Start with the overview diagram and define Performance as the outcome in the center. Then move through the indicator-detail slides one at a time, tying each factor to a real behavior or decision. The muted inactive arrows help the audience focus while still seeing the relationship to the full performance model.
Q: Who is this performance diagram best suited for?
A: This template fits managers, HR trainers, consultants, and team leads who need to explain a conceptual performance framework rather than report numeric results. It works well for short workshops, leadership briefings, and productivity conversations where Success, Control, Personal Abilities, and Productivity need to be discussed as connected drivers.
Q: Why does the diagram place Performance in the center with arrows pointing around it?
A: The center placement turns Performance into the shared outcome, while the surrounding colored shapes act as visible drivers. The circular arrow treatment suggests an ongoing management cycle rather than a one-time checklist. This helps audiences understand that the four indicators influence each other and should be reviewed together.




Performance PowerPoint Diagram
5-slide presentation template for performance management, 4-step indicators, and process arrows
Performance PowerPoint Diagram is a 5-slide Microsoft PowerPoint template for explaining performance management factors. It centers a Performance box with four directional indicators: Success, Control, Personal Abilities, and Productivity. Visible layouts include a four-step performance diagram, single-indicator detail slides, and a dark summary slide for managers, trainers, and consultants.
- Category
- Process Diagrams
- Rating


 Loading...
- Aspect ratio
- 16:9
- Item ID
- 6503-01
- Colors
 Microsoft PowerPoint
  Microsoft Copilot
  Claude for PowerPoint
 Other formats supported
Subscribe today and get immediate
access to download our PowerPoint templates.