Slide 6 of 14 from Nature Business Growth Metaphor Template for PowerPoint
6165-01-business-growth-strategy-6
Growth Comparison Chart for Business Presentation
- Chart
- Bar Vertical
- Evaluation Slide
- 16:9
- 100% Editable
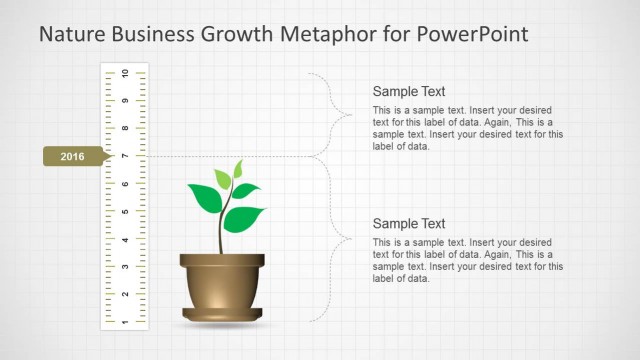
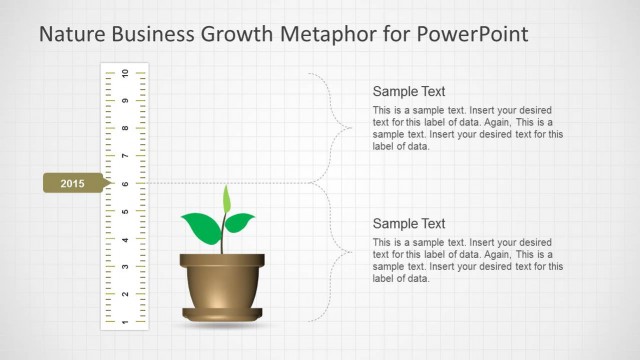
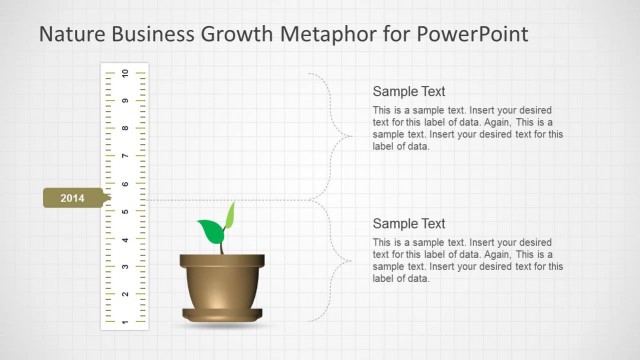
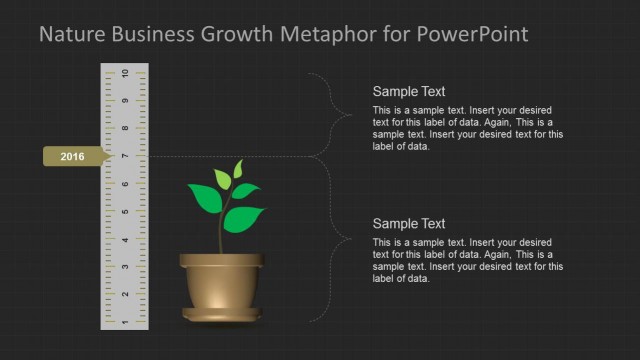
The Growth Comparison Chart slide from the Nature Business Growth Metaphor Template for PowerPoint offers a clear visual evaluation of annual progress using editable shapes and vector icons. This slide template is designed for business presentations, enabling users to effectively illustrate sales growth or performance trends over multiple years within a professional slide deck.
What’s on This Slide
The layout features a vertical ruler on the left side, labeled with years from 2014 to 2017. Four pots are arranged horizontally at the bottom, each containing a plant with varying heights. Text placeholders are positioned above each pot, aligned centrally, indicating space for data labels. The ruler and pots are visually distinct, with the ruler serving as a measurement guide. The background is a light grid pattern, enhancing the infographic style. The overall composition emphasizes growth over time through the visual hierarchy of the ruler and plant heights.
How to Use It
This layout serves as a growth comparison chart, ideal for illustrating progress over multiple years. It fits well in a business presentation sequence, particularly after problem identification and before strategic planning. Use this slide to showcase metrics such as sales growth, project milestones, or performance indicators. It is suitable for reports, annual reviews, or presentations focused on business development and growth strategies, providing a clear visual representation of data trends.
Text Placeholders & Capacity
Keep your copy within these limits so it fits without resizing. Node body slots can accommodate roughly 10 words each.
| Placeholder | Count | Max characters (approx.) |
|---|---|---|
| Item heading | 4 | 30 |
| Item body | 4 | 50 |
| Slide title | 1 | 50 |