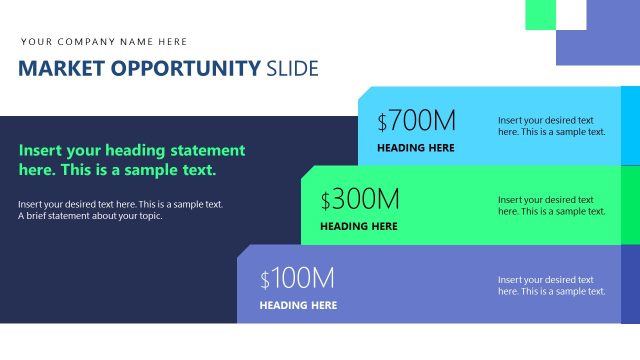
Slide 5 of 12 from Modern Pitch Deck PowerPoint Template
Market Opportunity Graphical Representation Slide
Market Opportunity Analysis Chart for Presentations
- Chart
- Bar Vertical
- Market Analysis Slide
- 16:9
- 100% Editable
The Market Opportunity Chart slide from the Modern Pitch Deck PowerPoint Template offers a clear vertical bar chart layout ideal for presenting market analysis data. This slide template supports business presentations and investment pitches by visually comparing market segments with editable shapes and vector icons, enhancing strategic discussions with precise financial insights.
What’s on This Slide
The slide features a vertical bar chart positioned centrally, displaying varying heights of green and dark green bars against a light gray background. The chart's y-axis is labeled with values up to 450, while the x-axis represents different categories. Above the chart, there is a bold title aligned to the left, with a placeholder for a subheading directly beneath it. To the right, two rectangular text boxes are present, one above the other, featuring sample dollar amounts and placeholder text. The overall layout emphasizes the chart as the primary visual element.
How to Use It
This layout serves to present market opportunity data, typically following a problem statement slide. It is suitable for business contexts where visualizing market size or potential revenue is crucial, such as investor pitches or strategic planning sessions. The structure allows for clear comparisons between different market segments, making it effective for showcasing growth potential. It is best used when specific financial figures and market analysis are required to support business strategies or funding requests.
Text Placeholders & Capacity
Keep your copy within these limits so it fits without resizing. Text slots are moderate, allowing for concise content.
| Placeholder | Count | Max characters (approx.) |
|---|---|---|
| Slide title | 1 | 30 |
| Subtitle | 1 | 50 |
| Item body | 2 | 40 |
Slide Keywords
Download unlimited PowerPoint templates, charts and graphics for your presentations with our annual plan.
DOWNLOADReturn to Modern Pitch Deck PowerPoint Template.