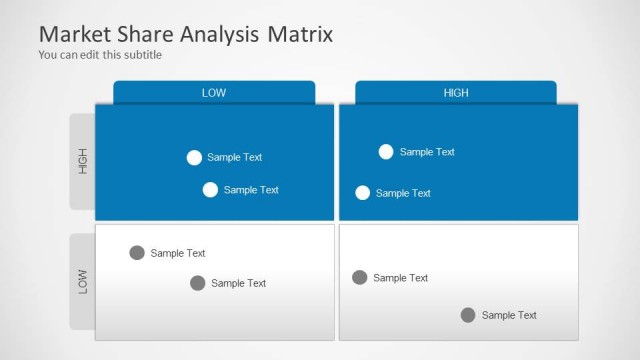
Slide 4 of 6 from Market Share Analysis Matrix for PowerPoint
8062-market-share-matrix-powerpoint-4
Market Share Analysis with Circle Sizes
- Diagram
- Matrix Quadrant
- Strategic Analysis Slide
- 16:9
- 100% Editable
The Market Share Analysis with Circle Sizes slide from the Market Share Analysis Matrix for PowerPoint template offers a clear visual tool for strategic planning. This diagram layout uses a four-quadrant matrix with editable shapes to represent market share and growth potential, making it suitable for business presentations focused on competitive positioning and market analysis. Its design supports effective communication of market opportunities using scalable circle sizes within a corporate presentation or pitch deck template.
What’s on This Slide
The layout features a four-quadrant matrix with two rows and two columns. Each quadrant is labeled with 'HIGH' or 'LOW' along the top and left sides. Inside each quadrant, there are circular nodes of varying sizes positioned centrally, accompanied by text placeholders below them. The text placeholders are aligned to the center of each quadrant. The background is light, and the quadrants are filled with a solid blue color. The overall composition emphasizes the size of the circles to represent different data points.
How to Use It
This layout serves as a market share analysis matrix, visually representing data based on two variables: market share and growth potential. It fits well in presentations discussing market positioning or competitive analysis. This structure is useful for businesses assessing their product or service positioning relative to competitors. It can also be applied in strategic planning sessions to visualize market opportunities and threats.
Text Placeholders & Capacity
Keep your copy within these limits so it fits without resizing. Node body slots can hold roughly 3-4 words each.
| Placeholder | Count | Max characters (approx.) |
|---|---|---|
| Slide title | 1 | 40 |
| Subtitle | 1 | 40 |
| Item body | 8 | 20 |
Slide Keywords
Download unlimited PowerPoint templates, charts and graphics for your presentations with our annual plan.
DOWNLOADReturn to Market Share Analysis Matrix for PowerPoint.