Slide 8 of 13 from Investment Opportunity Assessment PowerPoint Template
Ownership & Cap Table Impact Presentation Slide – Investment Opportunity Assessment Template
Ownership & Cap Table Impact Slide
- Table
- Comparison Table
- Financial Summary Slide
- 16:9
- 100% Editable
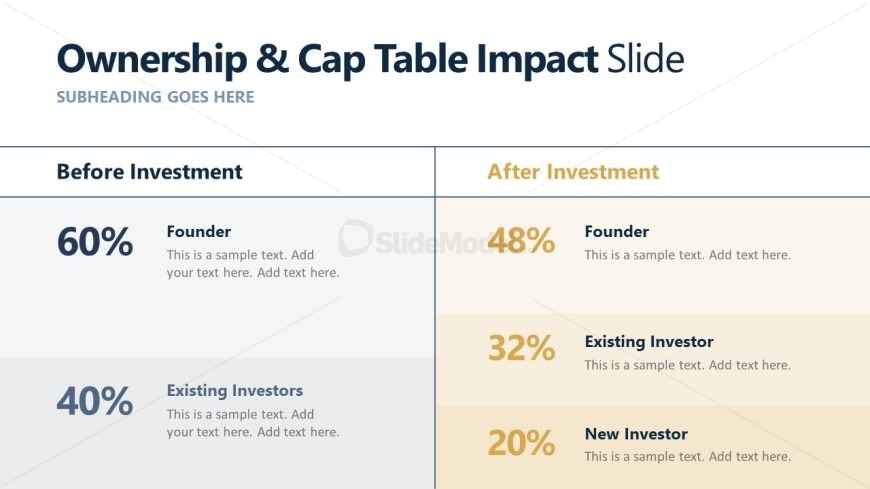
The Ownership & Cap Table Impact slide from the Investment Opportunity Assessment PowerPoint Template provides a clear comparison of stakeholder ownership percentages before and after investment. This slide layout is ideal for business presentations and pitch deck templates focused on financial impact and equity dilution, featuring editable shapes and organized tables to enhance investor relations discussions.
What’s on This Slide
The layout features two columns labeled 'Before Investment' and 'After Investment.' Each column contains rows with percentage figures and corresponding labels for stakeholders, such as 'Founder' and 'Existing Investors.' The text is aligned left, with the percentage figures prominently displayed. There are placeholders for additional text beneath each label. The overall structure is organized and clear, with a visual hierarchy that emphasizes the ownership changes pre- and post-investment. The background is light with contrasting text colors for clarity.
How to Use It
This layout serves to compare ownership percentages before and after an investment, making it suitable for presentations on investment opportunities. It fits well in a sequence that discusses financial impacts or stakeholder analysis. This slide is useful in scenarios where stakeholders need to understand the implications of new investments on ownership structures. It can also be employed in discussions about equity dilution and investor relations.
Text Placeholders & Capacity
Keep your copy within these limits so it fits without resizing. Node labels can hold roughly 3-5 words each.
| Placeholder | Count | Max characters (approx.) |
|---|---|---|
| Slide title | 1 | 30 |
| Subtitle | 1 | 30 |
| Item heading | 4 | 20 |
| Item body | 4 | 50 |
Slide Keywords
Download unlimited PowerPoint templates, charts and graphics for your presentations with our annual plan.
DOWNLOADReturn to Investment Opportunity Assessment PowerPoint Template.