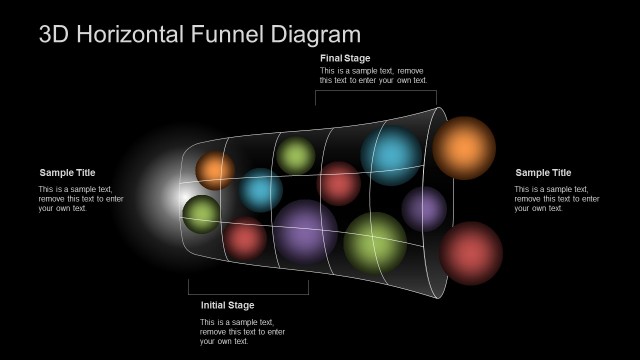
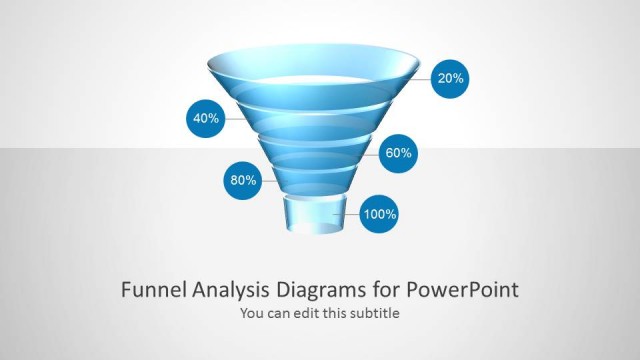
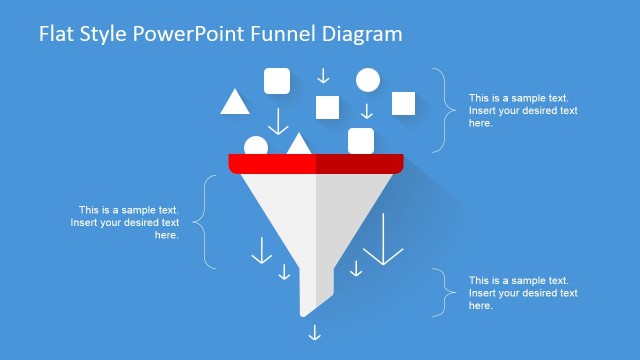
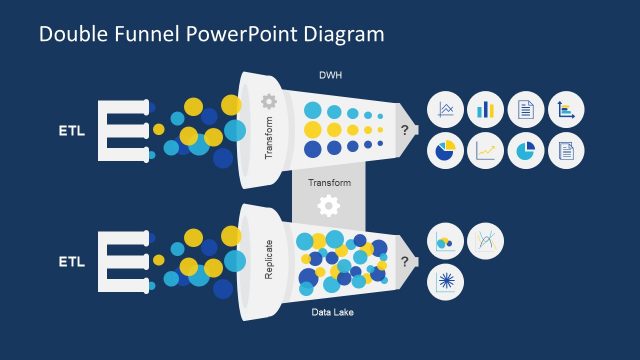
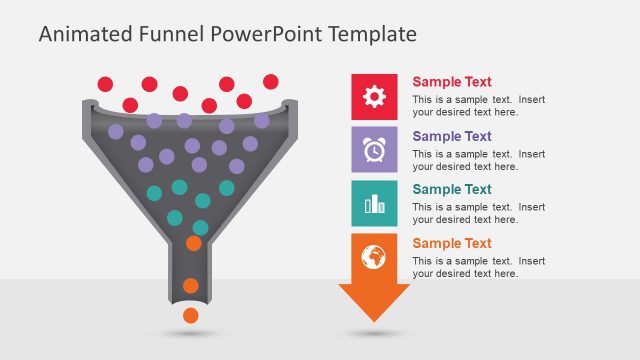
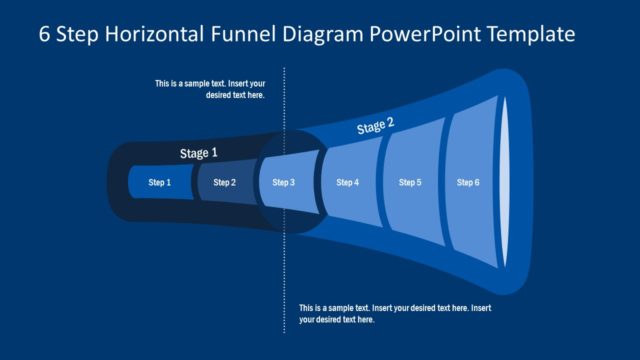
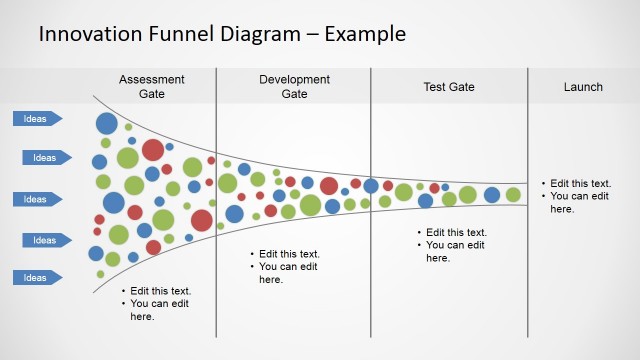
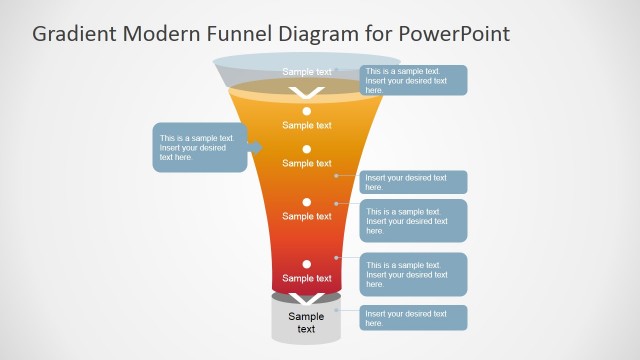
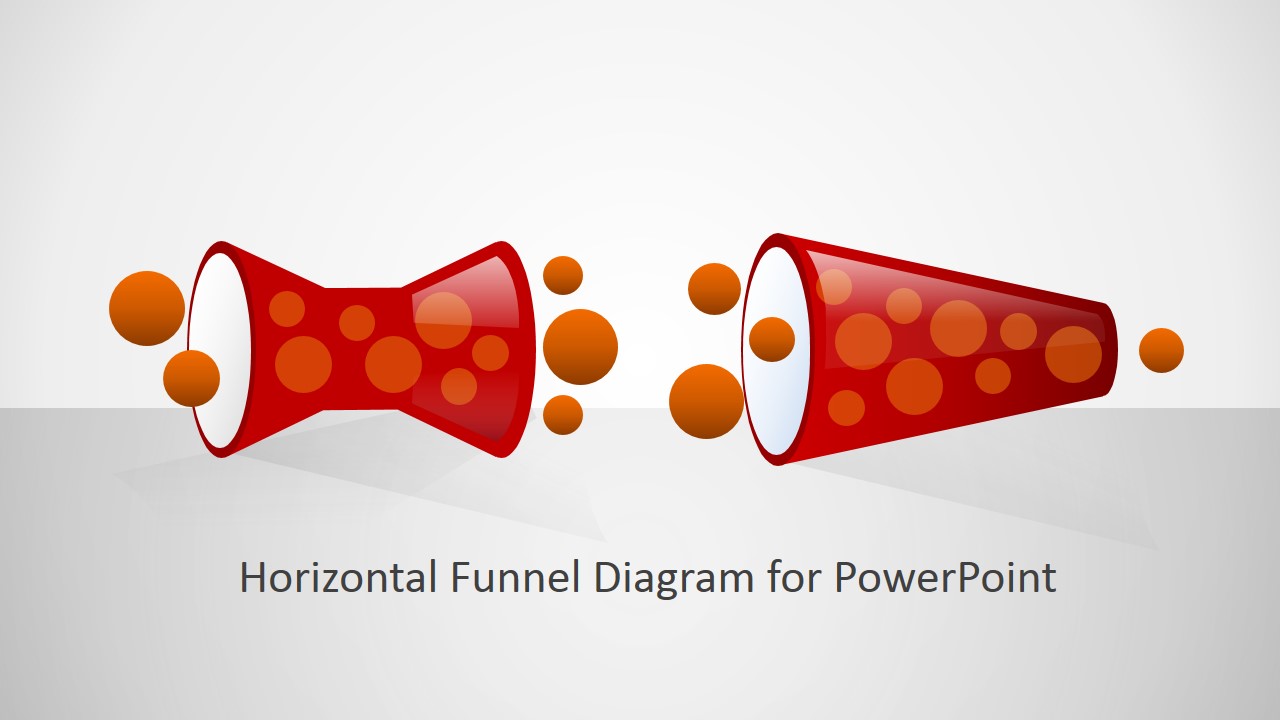
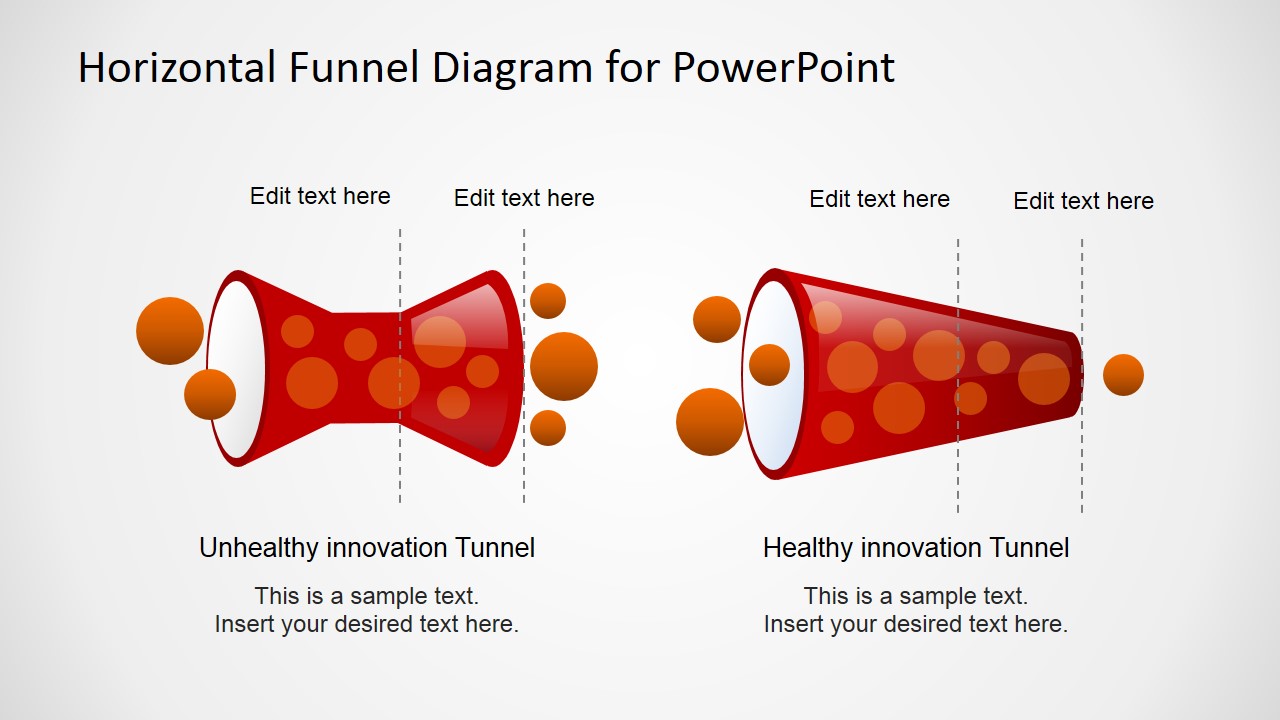
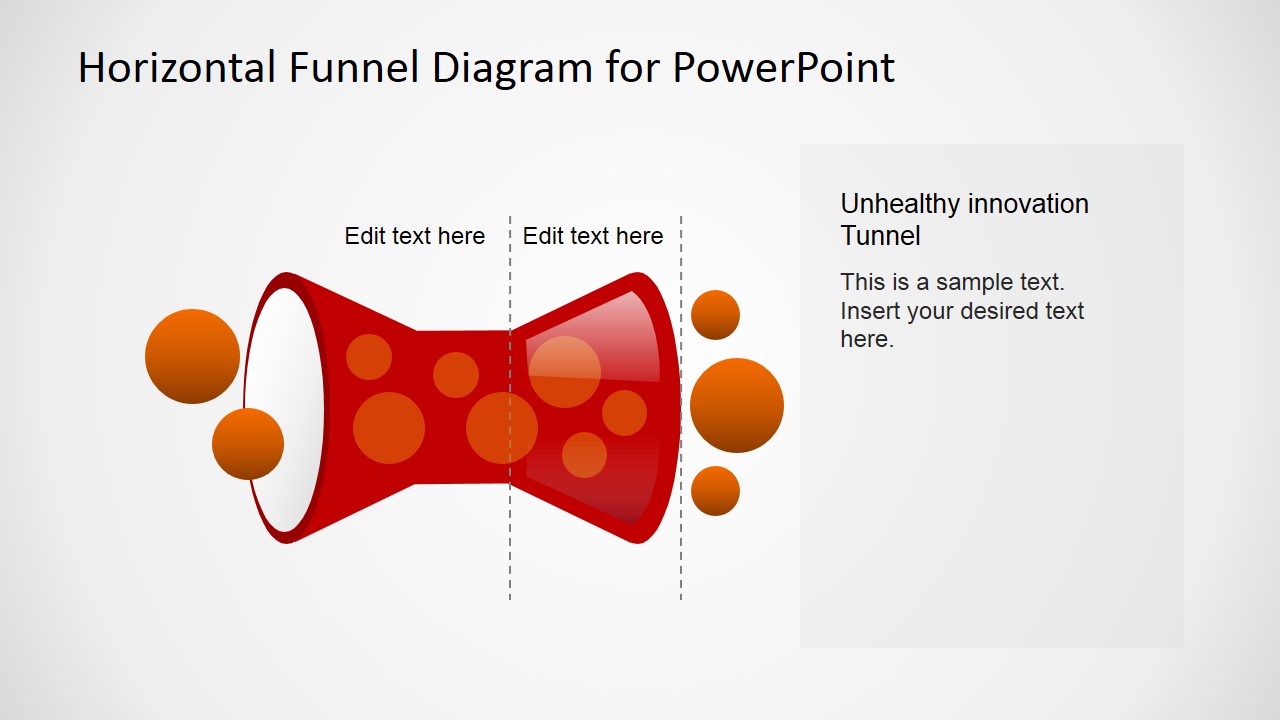
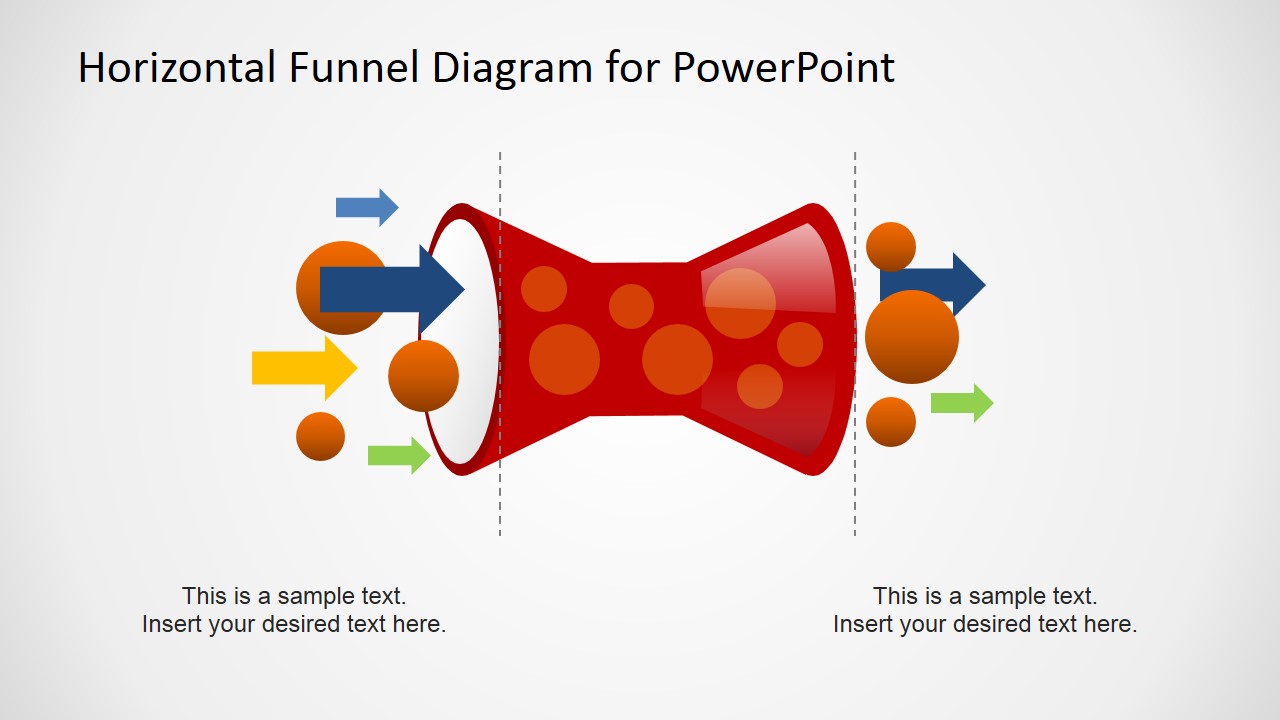
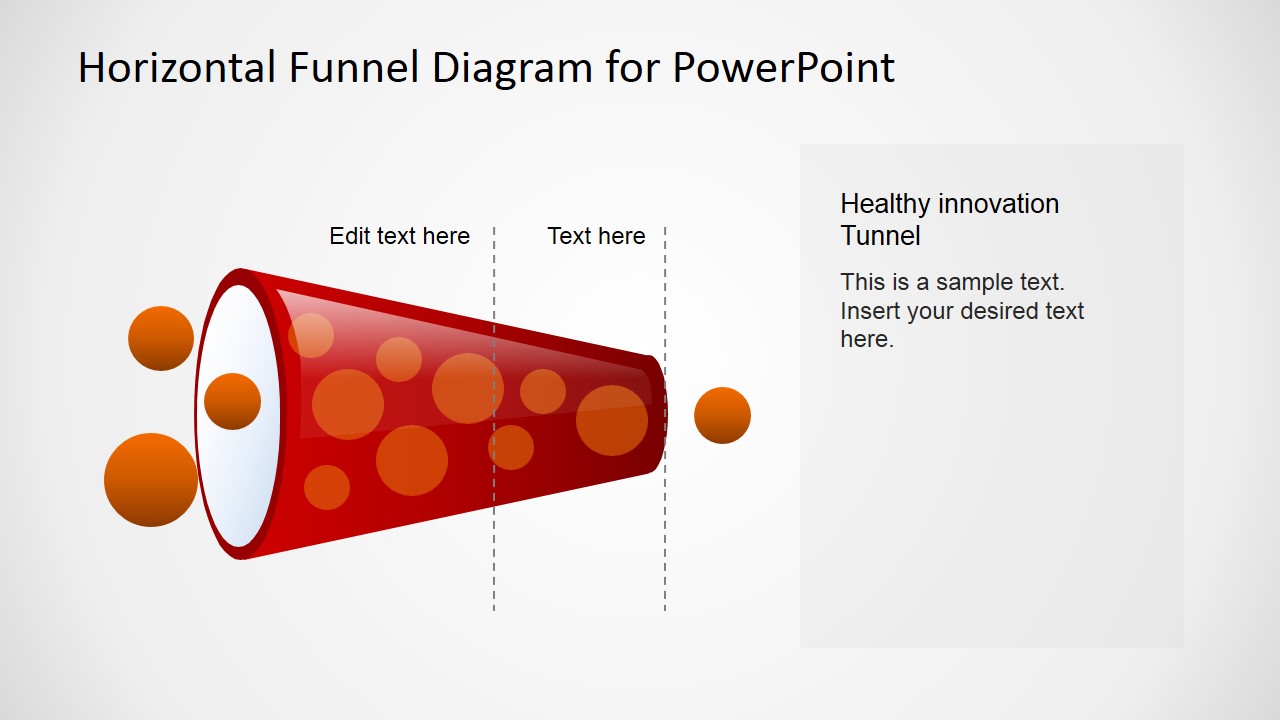
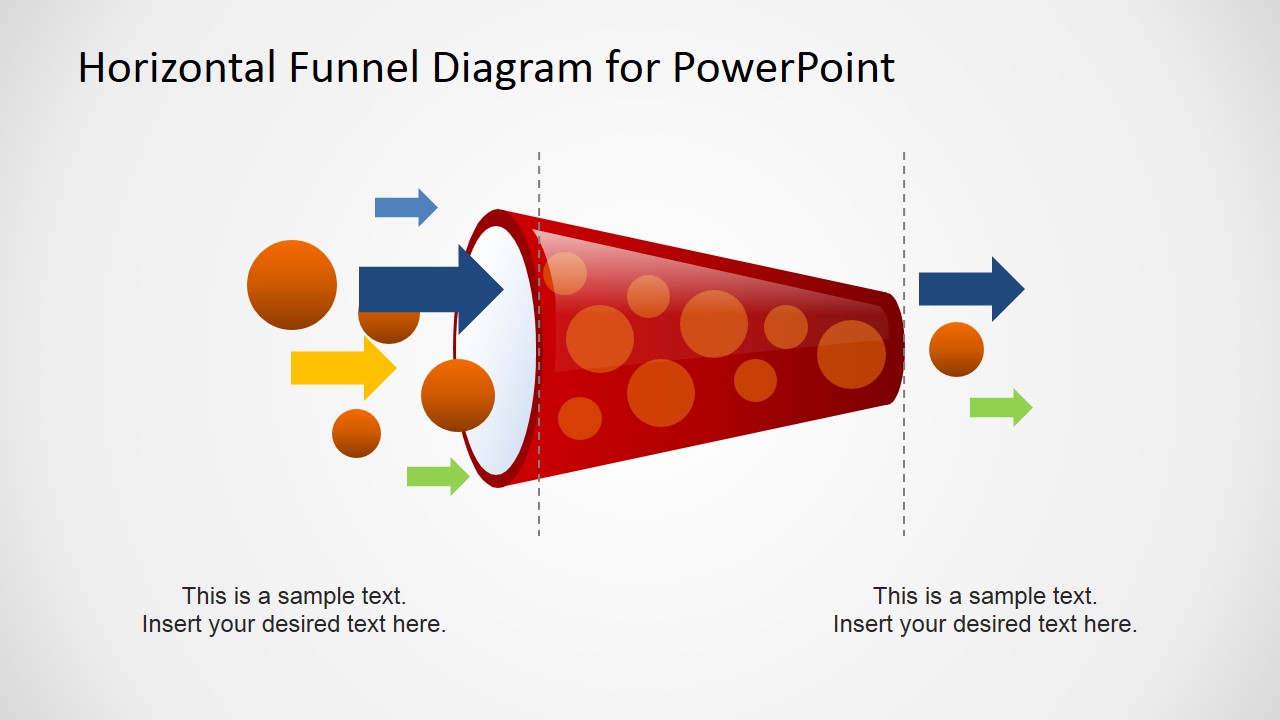
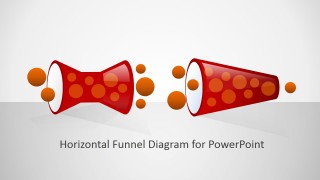
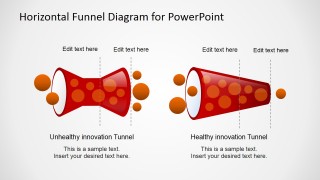
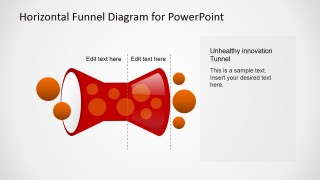
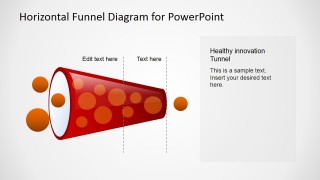
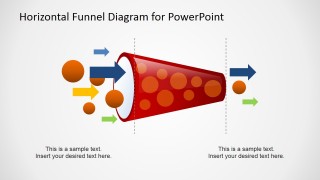
Horizontal Funnel Diagram for PowerPoint is a Professional Flat Design Funnel Diagram with two funnel metaphors, the healthy Funnel and the unhealthy Funnel. The healthy funnel has a wide side and a short side, sow the amount of fluid entering the wide side is bigger than the amount leaving the short side (in terms of diameter) The unhealthy funnel has 2 wide sides, generating and initial neck and then an open left of the funnel. This metaphors are used under the context of Marketing, Sales, Ideation, and Innovation, where on each step of the process flow, the amount of fluid going through the diameters is reduced until you reach a small number of Goal items.
Both funnels and the shapes decorating the slides are created as PowerPoint objects allowing the user to fully customize their appearance and properties. The user can change the items going through the funnel for other shapes as Icons, from our PowerPoint Icons Library, providing a higher level of context and profesisonal Look and feel. The slides are created using the most modern Flat Design, that appeals to global audiences. Create outstanding visual support for your speech with our Horizontal Funnel Diagram for PowerPoint
What’s inside this template
Example presentation scenarios
- A marketing manager can use the healthy vs unhealthy funnel comparison to explain why lead quality drops between campaign input and qualified opportunities.
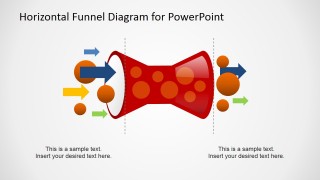
- A sales leader can use the arrow-based funnel slides to brief executives on where prospects enter, narrow, and exit the pipeline.
- A consultant can use the single funnel with a right-side callout panel to diagnose an innovation or ideation bottleneck for a client team.
- A product manager can use the stage divider labels to show how ideas, requests, or users are filtered through a decision process.
Features
- 100% editable presentation template
- Compatible with Microsoft PowerPoint and Google Slides
- 16:9 aspect ratio slides
- Scalable vector shapes, icons and illustrations
- AI-Ready for Microsoft Copilot and Claude
- Instant access and download
Frequently asked questions
Q: How should a presenter explain the healthy and unhealthy funnel comparison clearly?
A: Start with Slide 2 because it places both funnel metaphors side by side. Define what enters the wide opening, what narrows at each divider, and what the final output represents. Then use the single-funnel slides to discuss one case in detail, keeping each label tied to a real stage in the audience's process.
Q: Who is this funnel diagram best suited for?
A: This template fits marketing, sales, product, and consulting presenters who need to explain process reduction without building a full analytics report. It works well when the message is conceptual: leads, ideas, purchases, or opportunities enter a funnel, pass through filters, and produce a smaller set of qualified outcomes.
Q: Why does the horizontal funnel metaphor help the audience understand the process?
A: The left-to-right shape turns narrowing into a visual path, so the audience can read the process as movement rather than as disconnected stages. The unhealthy funnel widens again, which signals leakage or poor filtering, while the healthy funnel tapers toward a controlled output. Arrows and bubbles reinforce volume and direction.
Horizontal Funnel Diagram for PowerPoint
6-slide diagram presentation template for sales funnel flow, conversion stages, and healthy vs unhealthy pipelines
Horizontal Funnel Diagram for PowerPoint is a 6-slide diagram template for showing sales, marketing, purchase, or innovation flow. It includes healthy and unhealthy horizontal funnel variants, stage markers, input-output arrows, and callout panels. The template is designed for Microsoft PowerPoint and Google Slides.
- Category
- Diagrams
- Rating


 Loading...
- Aspect ratio
- 16:9, 4:3
- Item ID
- 6559-02
- Colors
 Microsoft PowerPoint
  Microsoft Copilot
  Claude for PowerPoint
 Other formats supported
Subscribe today and get immediate
access to download our PowerPoint templates.