5 Components Generation KPI Slide Design
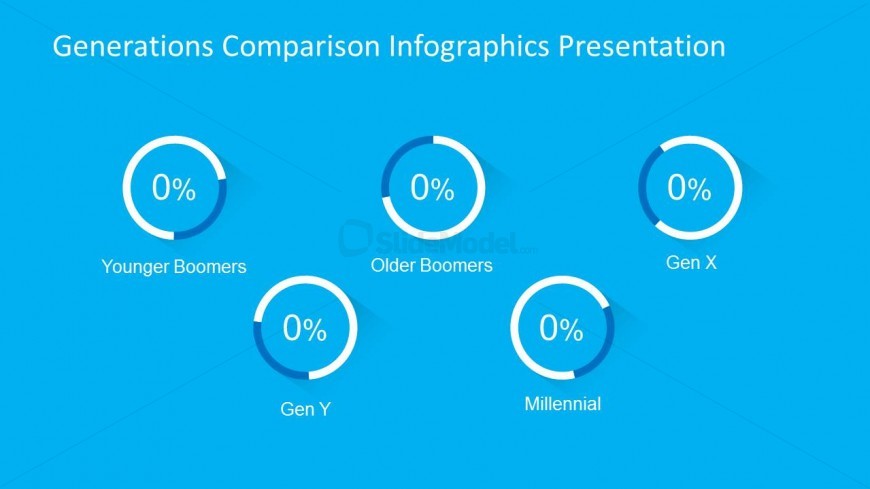
Contained in this PowerPoint template is a Five Components Generation KPI Slide Design. The slide contains five doughnut charts that can be used to present data on generations. Each doughnut chart includes a text placeholder for percentages and a label for the specific generation being presented.
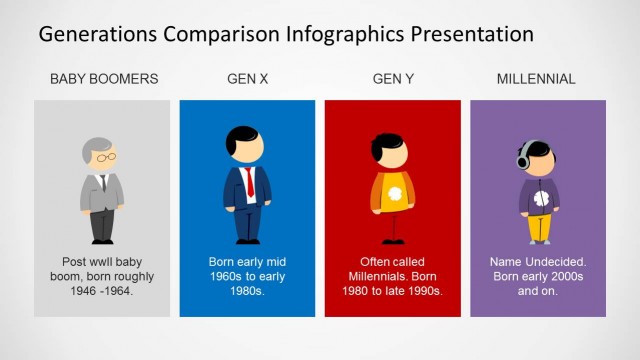
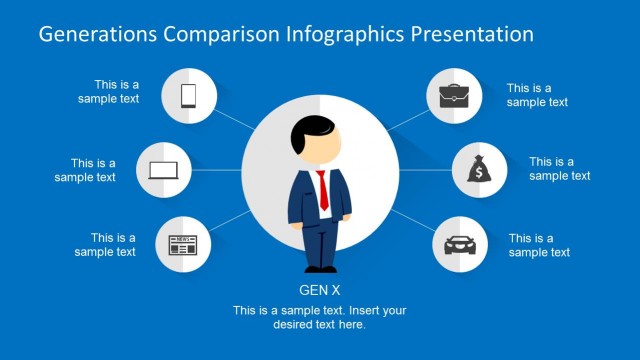
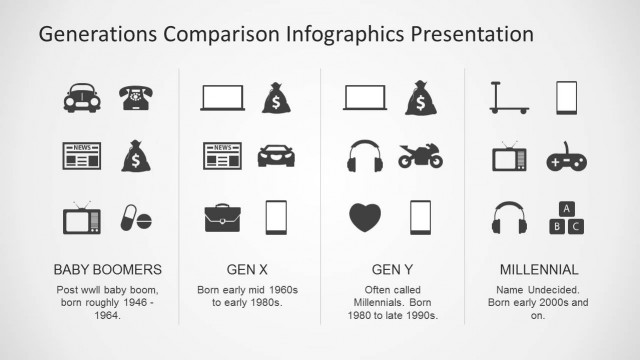
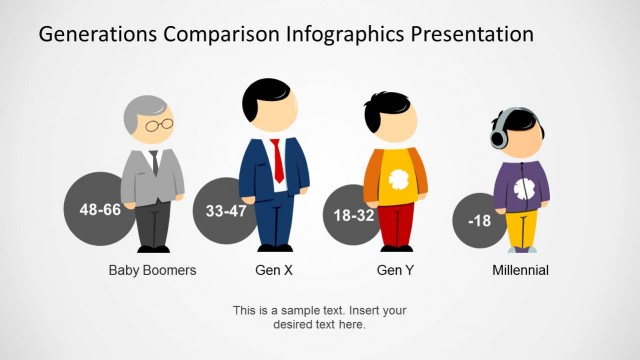
The five generations in the slide are younger boomers, older boomers, Gen X, Gen Y, and Millennial. This presentation of these generations can be applied to marketing plans in showing different target markets. The presenter can edit the position or arrangement of the PowerPoint icons. Any modification will not affect the image resolution of the design.
Return to Generations Comparison PowerPoint Template.