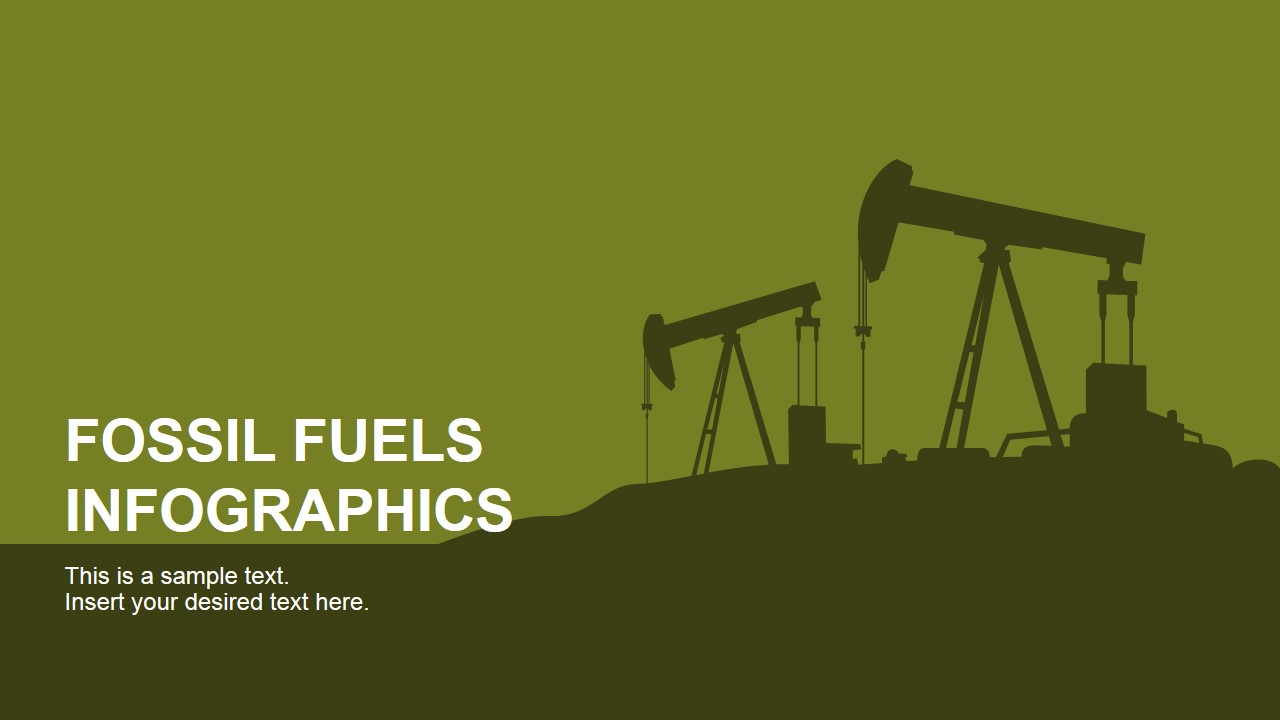
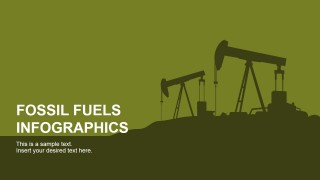
Fossil Fuels Infographics for PowerPoint
Fossil Fuels Infographics for PowerPoint – This PowerPoint template provides professional PowerPoint Shapes and PowerPoint Icons featuring the fossil fuels theme. The user can create Infographics referencing non renewable energy sources and data around them. Communicate data with simple visual graphics that will engage your audience.
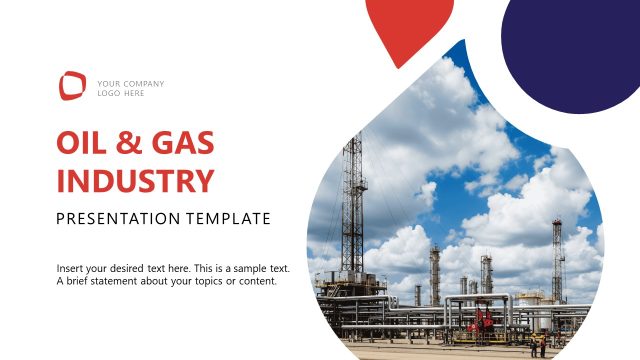
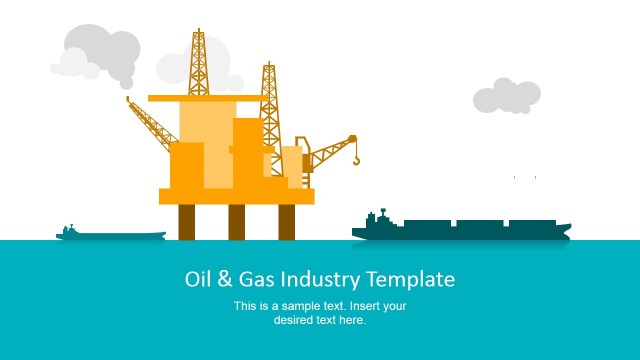
The Fossil Fuels term is used to denote energy sources formed by natural processes that happened over dead organisms. The main characteristic of fossil fuels is its high content of carbon. The more common fossil fuels are the coal, petroleum (crude oil) and natural gas. Fossil Fuels are considered a non-renewable resource because it takes millions of years for the natural processes to form reserves.
In the 20th century, after years of research, the use of fossil fuels has raised a serious environmental problem. The burning of fossil fuels produces incredible amounts of carbon dioxide per year that overpass the availability natural processes to absorb it. Carbon dioxide is one of the main greenhouse effect gases and the use of fossil fuels is contributing to global warming.
Fossil Fuels are extremely important in modern economy. When burnt, they produce significant amounts of energy per unit of weight, being an extremely efficient source of energy.
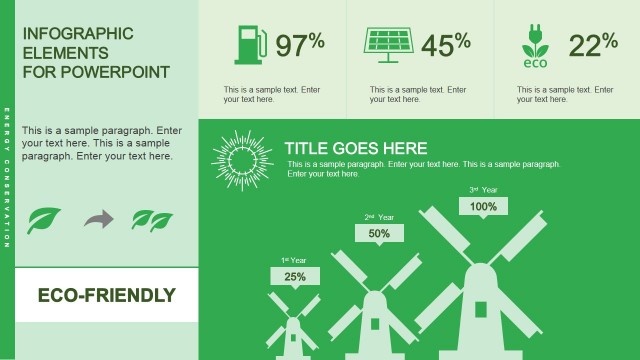
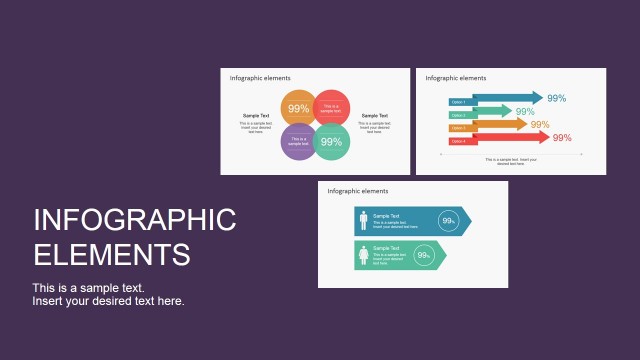
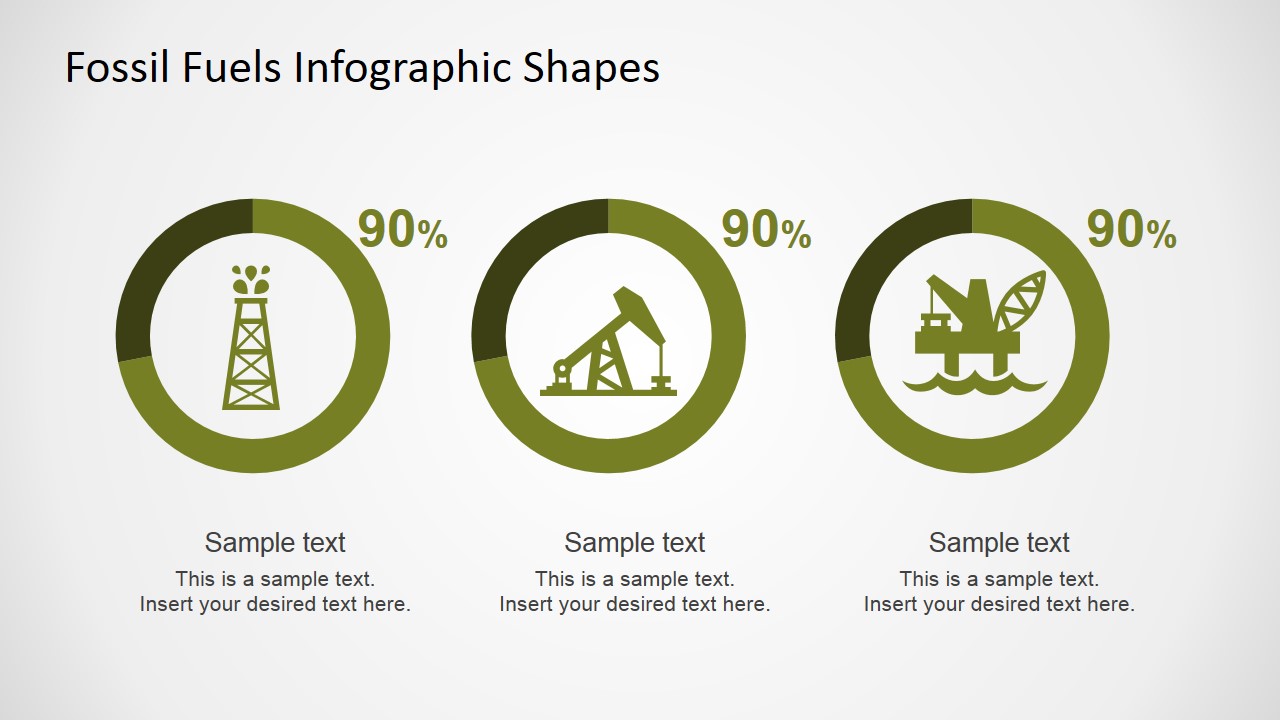
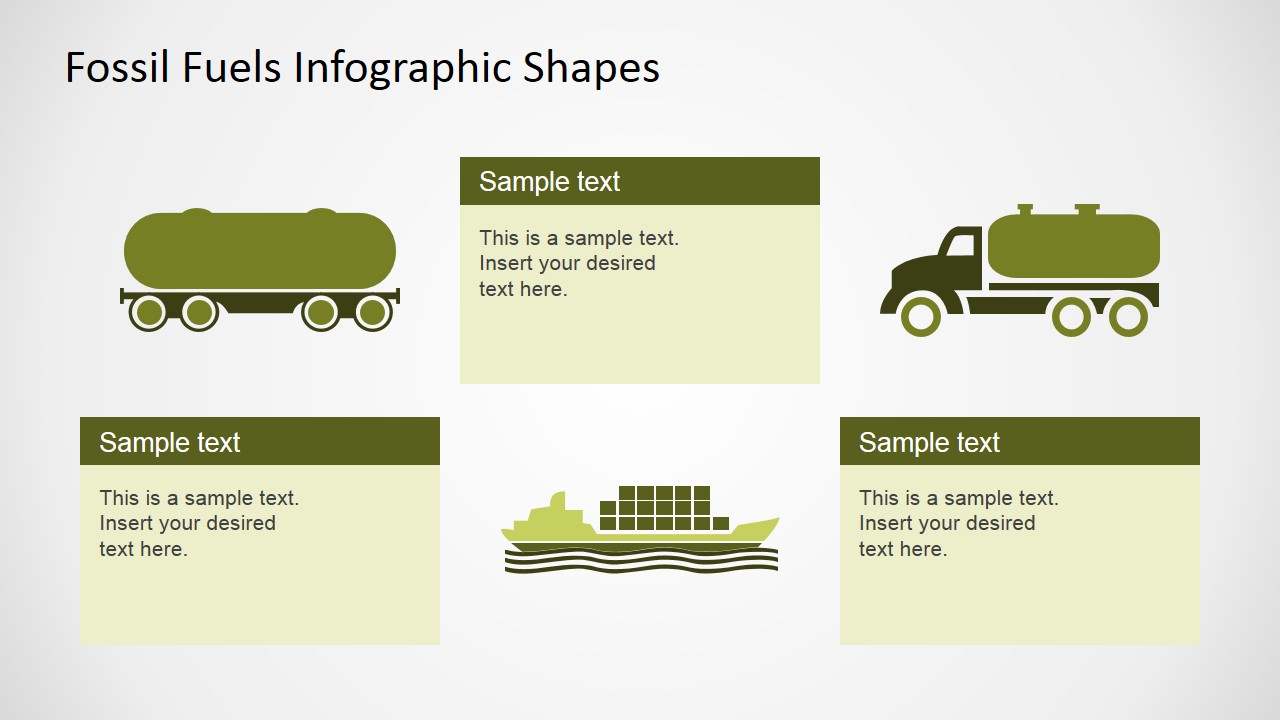
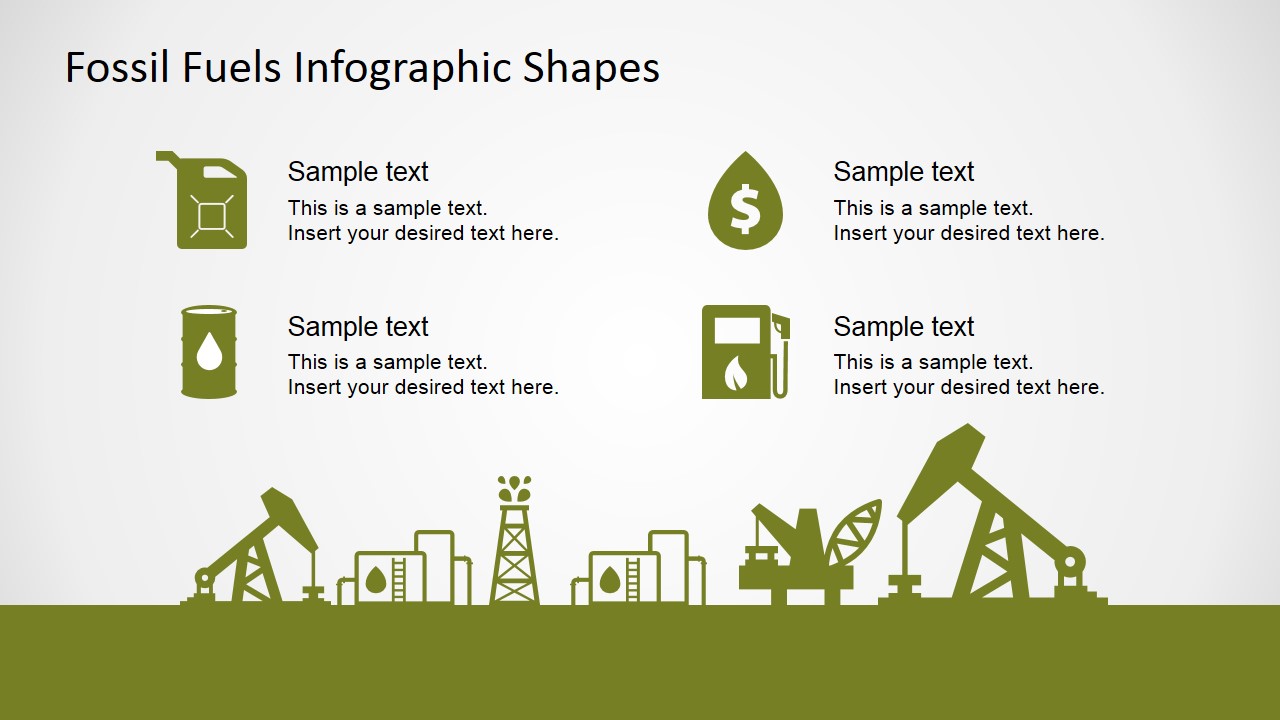
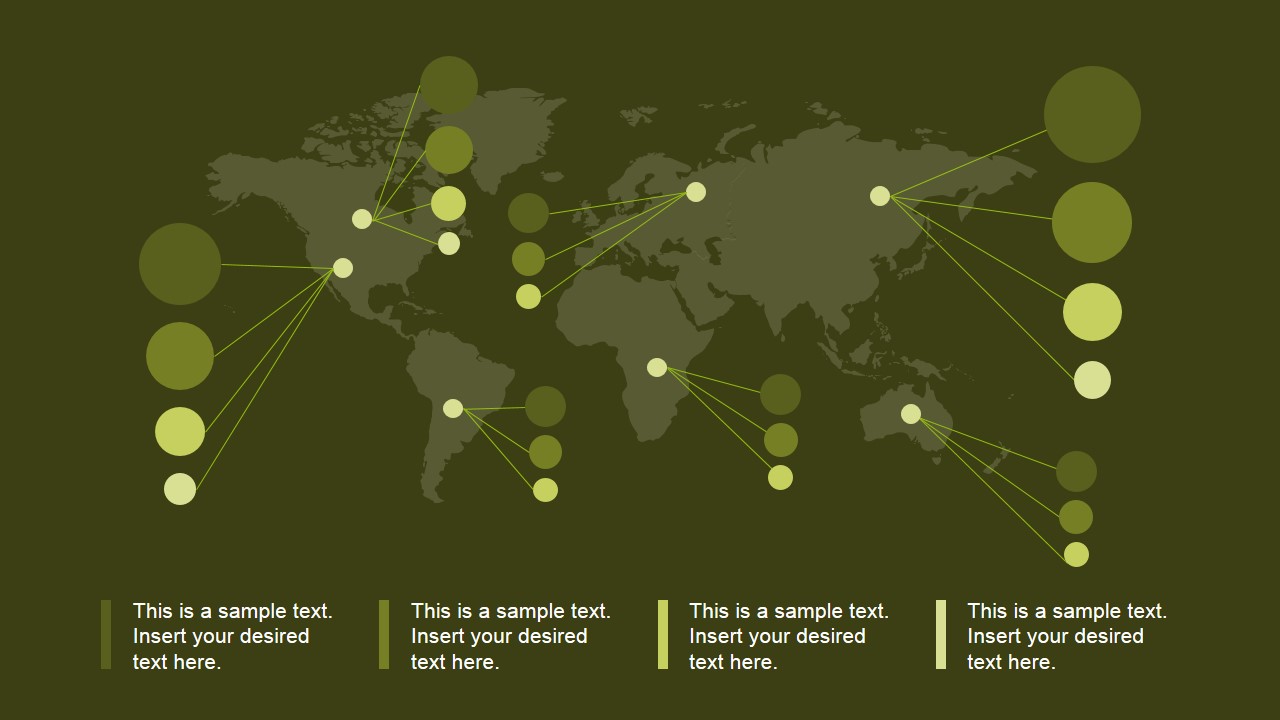
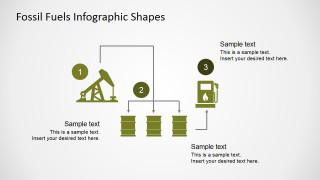
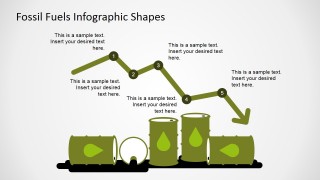
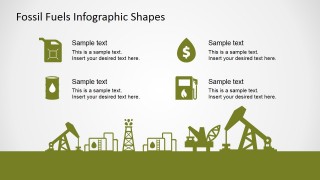
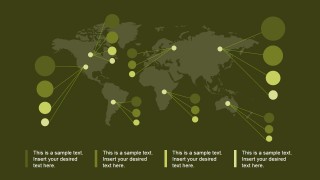
The Fossil Fuels Infographics for PowerPoint can be applied for environmental presentations, that requires the explanation of fossil fuels consumptions and their volumes. The presentation contains the following graphics:
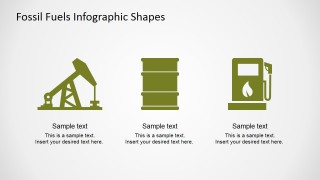
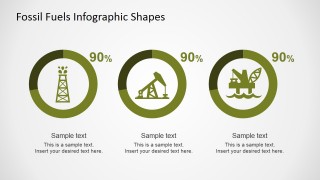
- Oil Pump
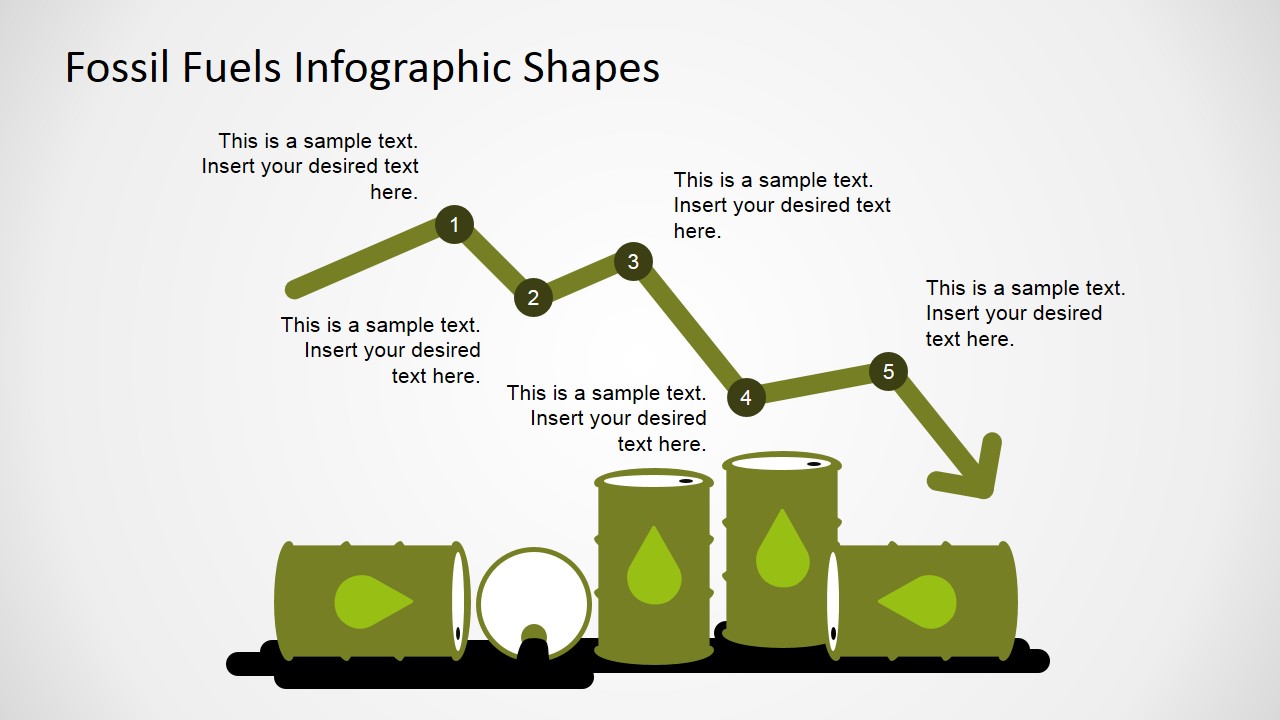
- Oil Barrels
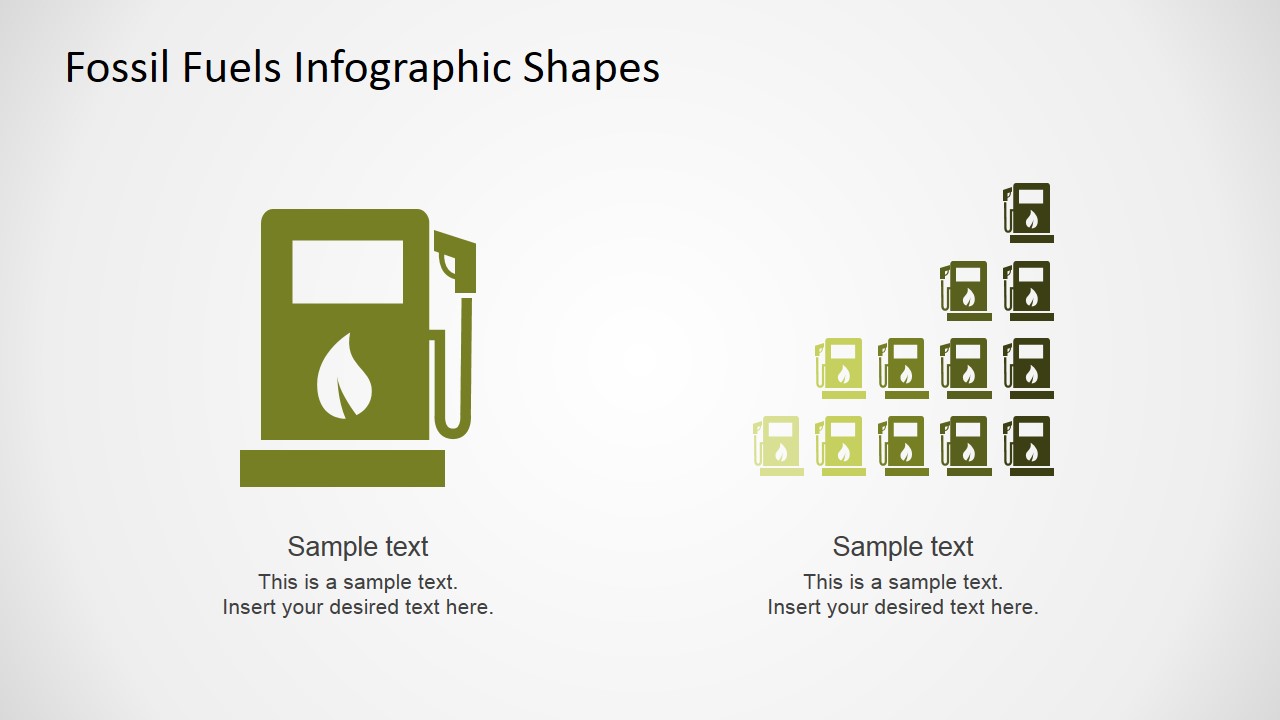
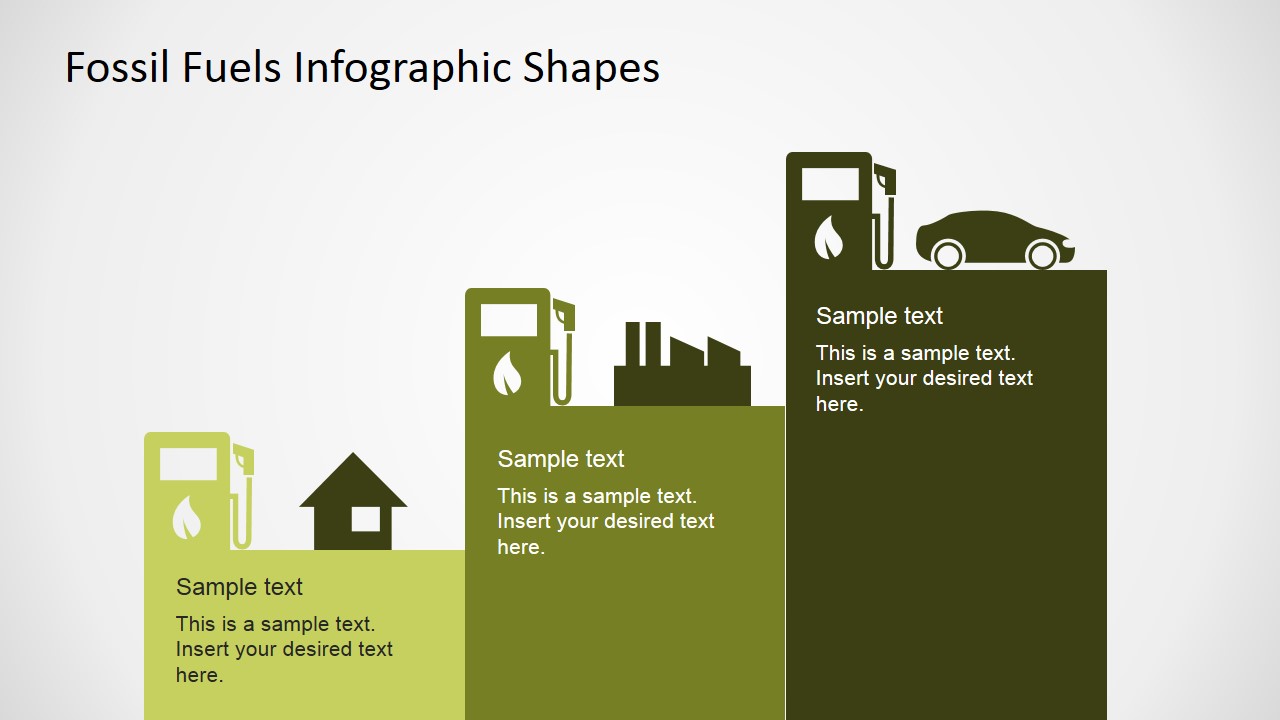
- Gas Pump
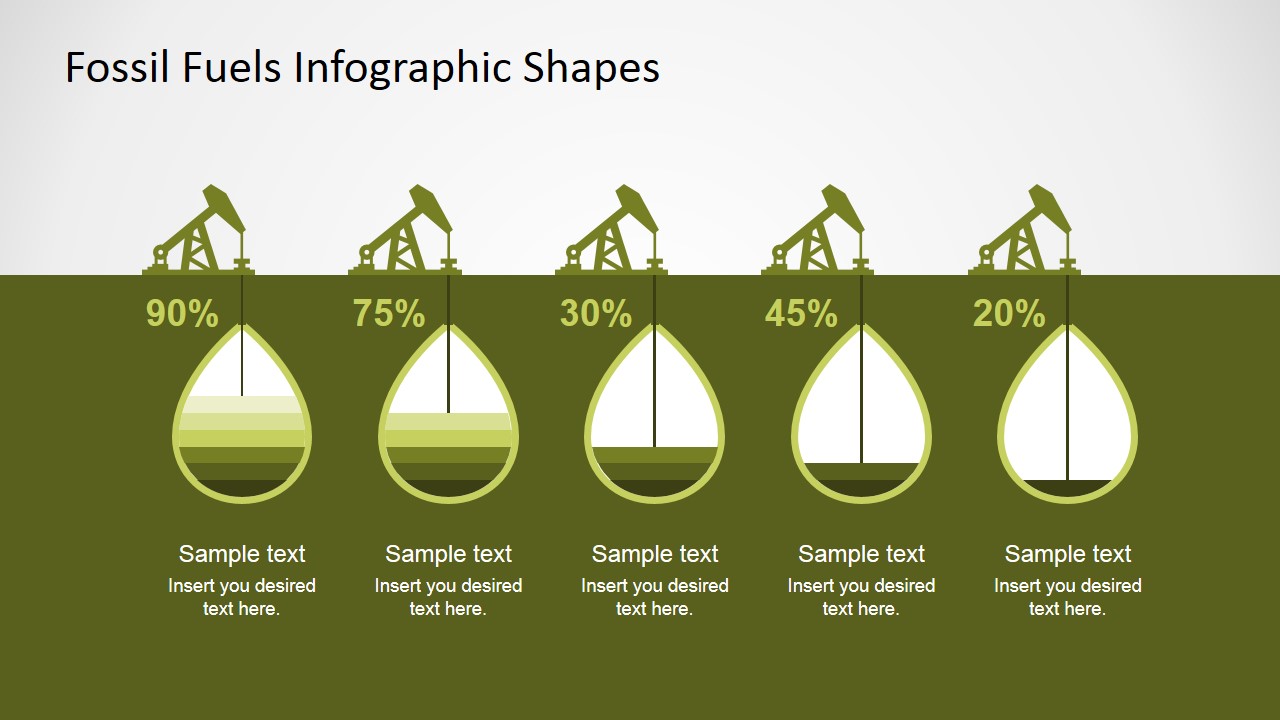
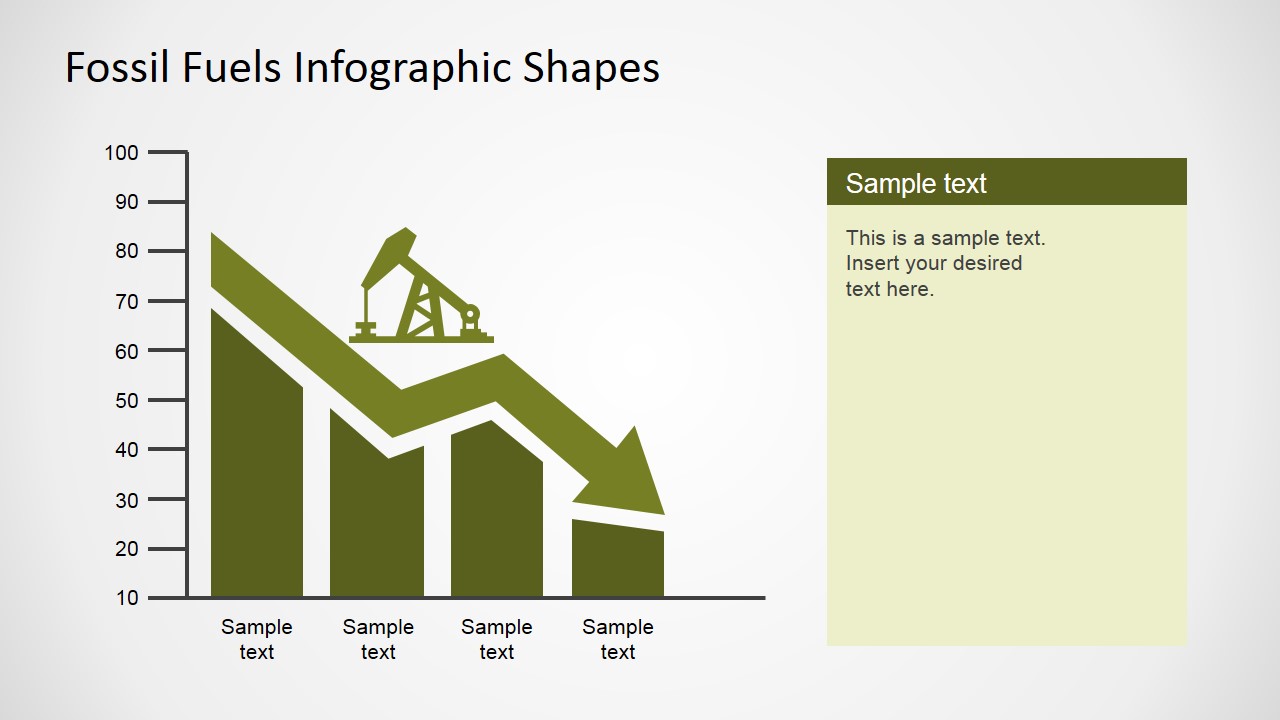
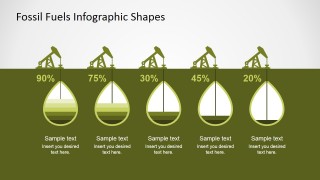
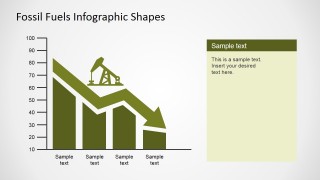
- Oil Extraction Pump Infographic
- Gas Usage Chart
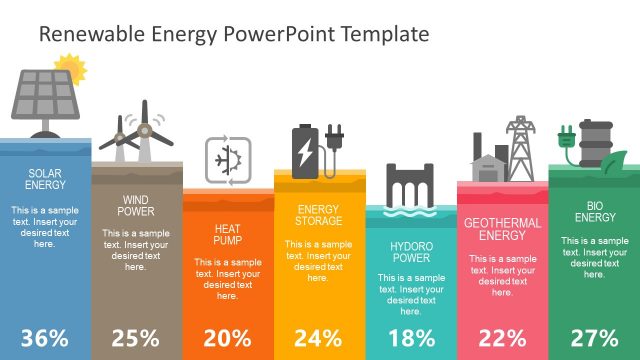
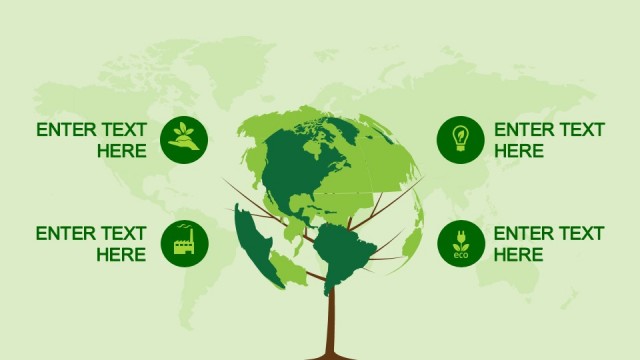
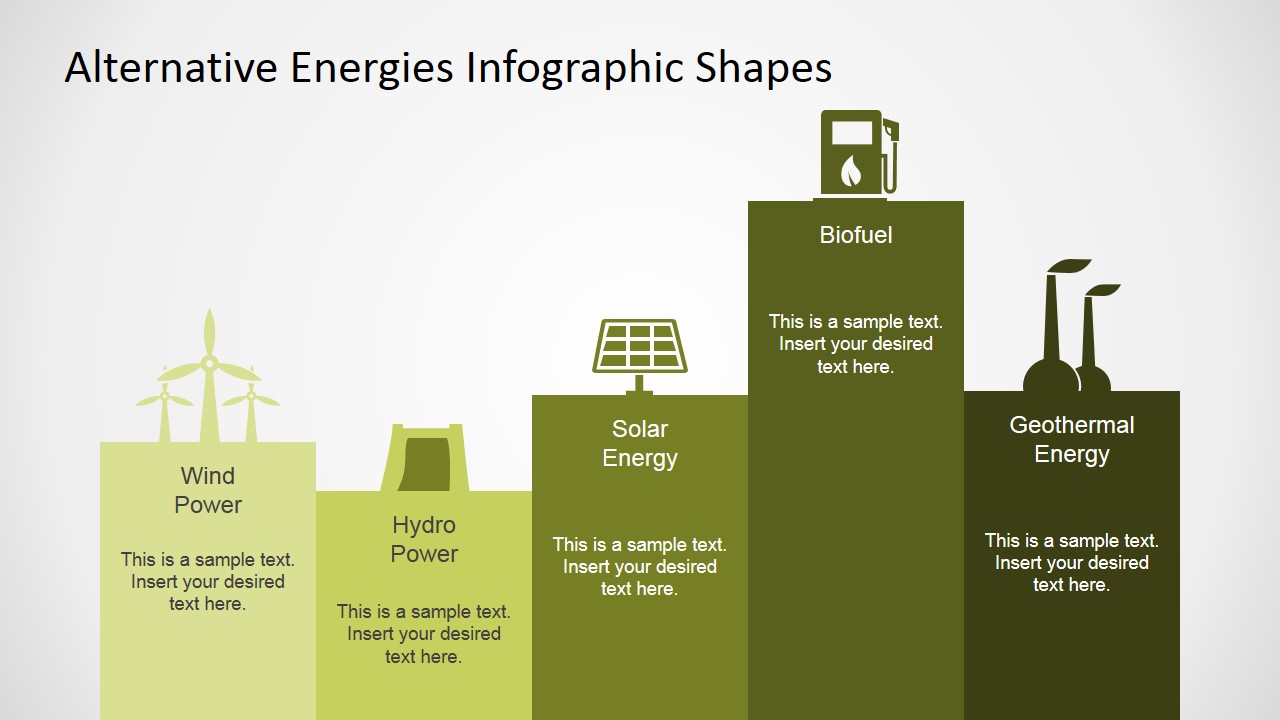
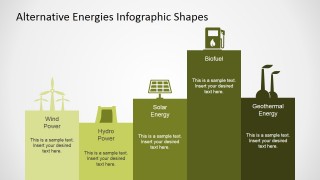
- Alternative Energies Icons
- Wind Mill Turbine
- Solar Panels
- Bio Thermal Energy
- Bio Fuel
Another practical use of the PowerPoint Infographic elements is the topic of fossil fuels prices. Fossil fuels are considered commodities, and their prices is traded in the stock and international markets. Users can describe the trends on oil and gas prices using the Fossil Fuels Infographics for PowerPoint and create professional presentations that appeal to executive audiences.


You must be logged in to download this file.
DOWNLOAD- Category
- Shapes
- Rating

 Loading...
- Size
- 16x94x3
- Item ID
- 7016-01
- Colors
Subscribe today and get immediate
access to download our PowerPoint templates.