Harvey Ball Pie Chart Graphics for PowerPoint
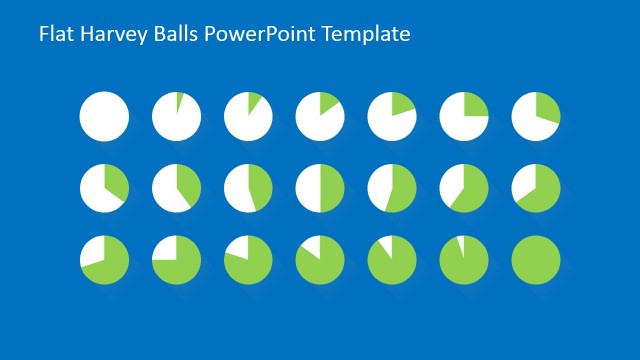
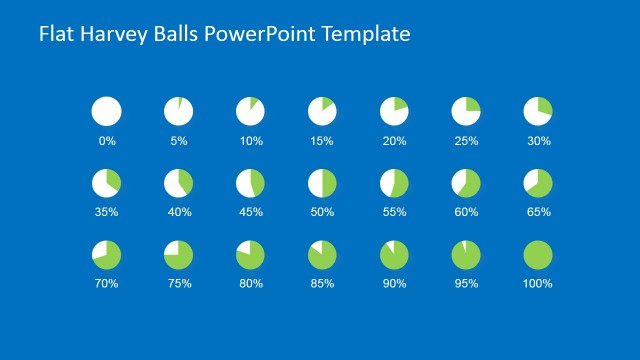
The Harvey Ball Pie Chart Graphics for PowerPoint can show the relative percentage of completion for a series of corporate projects and business plans. The Harvey Ball graphics are featured in a quarterly interval, going from 0% to a quarter, to half, to a full-filled circle. These percentages can be modified to the respective surface area representing the plan.
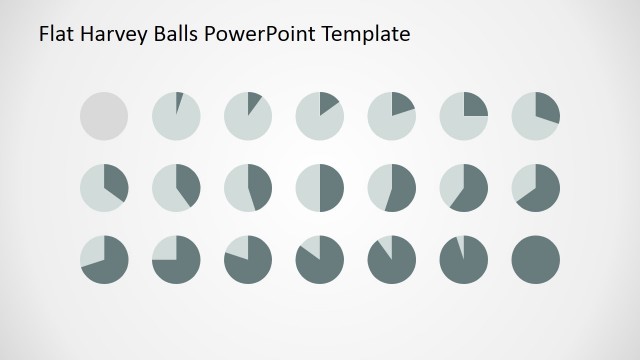
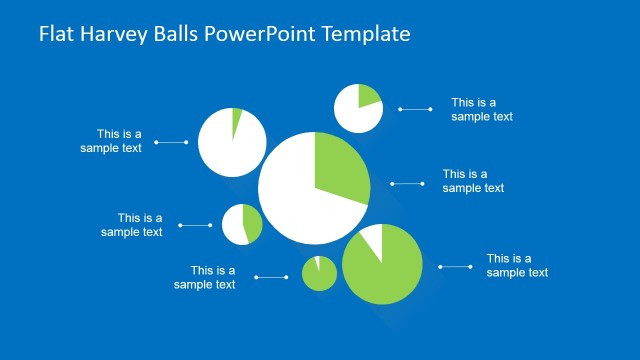
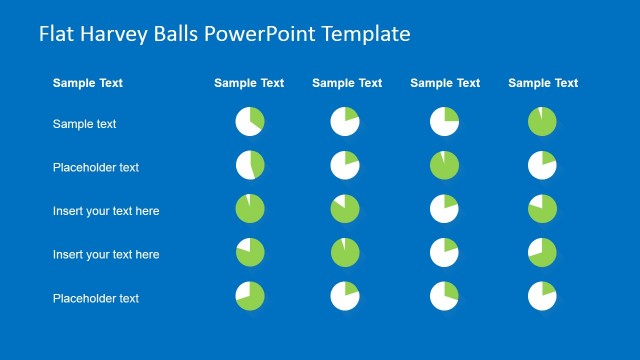
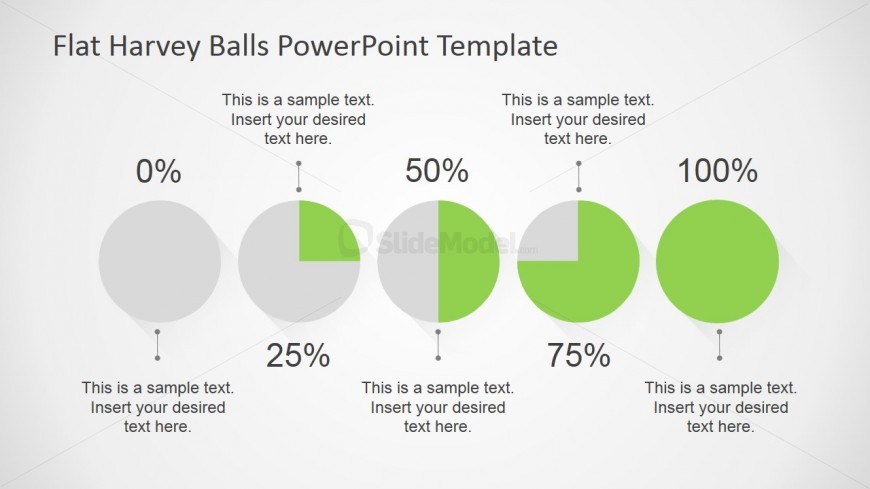
The slide has a light presentation background, to focus on the gray circular PowerPoint shapes. Five pie charts are arranged in a horizontal line on the slide. Each of these represents a certain percentage. This percentage is shown on a placeholder near the circles. The PowerPoint objects are 100% customizable. They can be modified to fit the presenter’s specifications.
Return to Flat Harvey Ball PowerPoint Template.