Slide 9 of 12 from Excellence PowerPoint Template
Excellence Data Chart PowerPoint
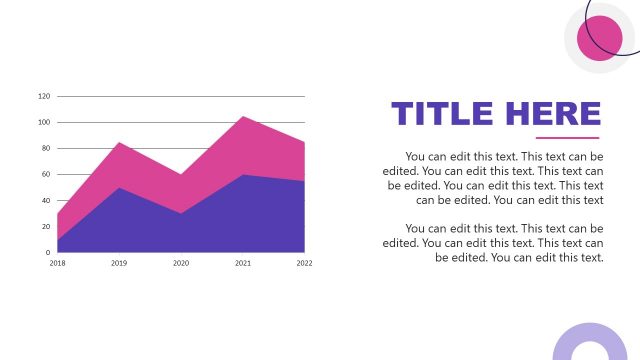
Data Chart Slide for Presentations
- Chart
- Bar Vertical
- Statistics Slide
- 16:9
- 100% Editable
What’s on This Slide
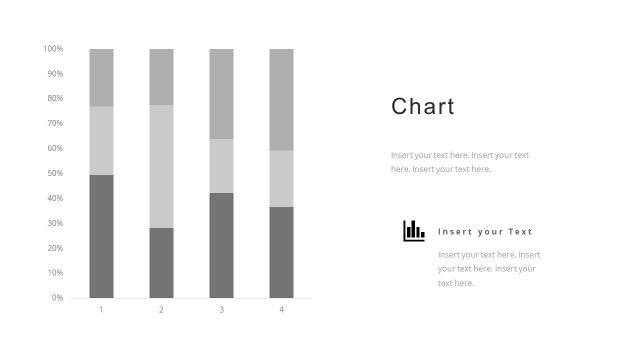
The slide features a vertical bar chart positioned centrally, with five bars of varying heights. The tallest bar is highlighted in purple, while the others are in gray. A title placeholder is located at the top, aligned left, with additional text placeholders beneath the chart for descriptions. A large numeric placeholder appears on the right side, emphasizing a value of 36.4M. A logo placeholder is positioned at the top left corner. The background is predominantly white, creating a clean layout with a clear visual hierarchy.
How to Use It
This layout serves as a data visualization tool, ideal for presenting quantitative information in a clear manner. It fits well in a presentation sequence after introducing key metrics or performance indicators. This structure is useful for business reports, financial summaries, or project updates, where visual data representation is essential for audience understanding. It allows for easy comparison of values across different categories.
Text Placeholders & Capacity
Keep your copy within these limits so it fits without resizing. Body slots are tight, roughly 15 words each.
| Placeholder | Count | Max characters (approx.) |
|---|---|---|
| Slide title | 1 | 20 |
| Item heading | 5 | 10 |
| Item body | 5 | 15 |
| Body paragraph | 2 | 100 |
| Kpi value | 1 | 10 |
| Kpi caption | 1 | 30 |
Slide Keywords
Download unlimited PowerPoint templates, charts and graphics for your presentations with our annual plan.
DOWNLOADReturn to Excellence PowerPoint Template.