Slide 11 of 13 from Enterprise Business PowerPoint Template
KPIs and Success Metrics Discussion – Enterprise Business PPT Template
KPI and Success Metrics Overview
- Chart
- Bar Vertical
- Kpi Reporting Slide
- 16:9
- 100% Editable
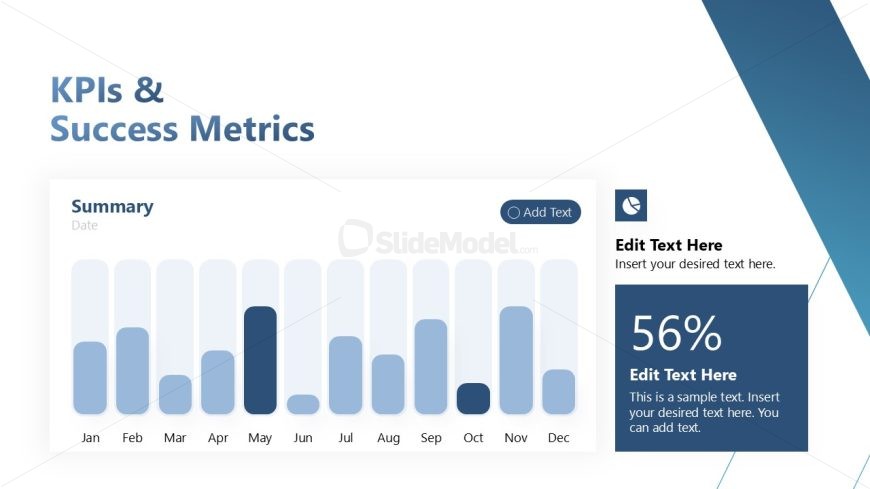
The KPI and Success Metrics Chart slide from the Enterprise Business PowerPoint Template offers a clear visual summary of key performance indicators using editable slides with a vertical bar chart. This layout is designed for business presentations, enabling effective tracking of project progress and quarterly performance reviews through customizable data visualization and vector icons.
What’s on This Slide
The layout features a bar chart positioned centrally, displaying monthly data from January to December. The bars vary in height, representing different values, with the highest bar in May. Above the chart, there are text placeholders for a title and a summary, aligned left. To the right, a large text placeholder shows a percentage value, with an additional smaller placeholder for descriptive text below it. The background is a gradient from light to dark blue, enhancing visual hierarchy. An icon placeholder is also present in the upper right corner.
How to Use It
This layout serves as a performance overview, ideal for presenting key performance indicators and success metrics. It fits well in a business presentation sequence, particularly after discussing strategies or challenges. Use this slide to summarize results, track progress over time, or highlight achievements. It is suitable for quarterly reviews, project updates, or performance assessments, providing a clear visual representation of data.
Text Placeholders & Capacity
Keep your copy within these limits so it fits without resizing. Node labels are tight, roughly 5 words each.
| Placeholder | Count | Max characters (approx.) |
|---|---|---|
| Slide title | 1 | 30 |
| Item heading | 12 | 10 |
| Item body | 1 | 100 |
| Kpi value | 1 | 10 |
| Body paragraph | 1 | 150 |
Slide Keywords
Download unlimited PowerPoint templates, charts and graphics for your presentations with our annual plan.
DOWNLOADReturn to Enterprise Business PowerPoint Template.