Weekly Schedule Gantt Chart for PowerPoint
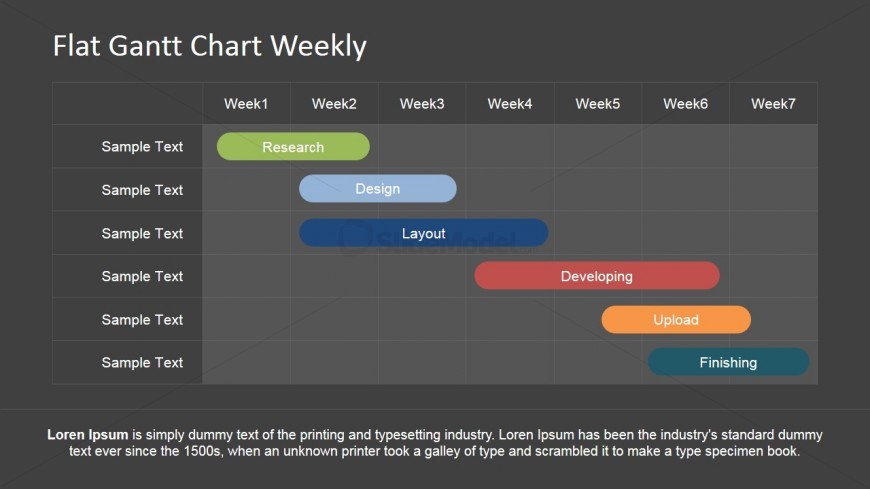
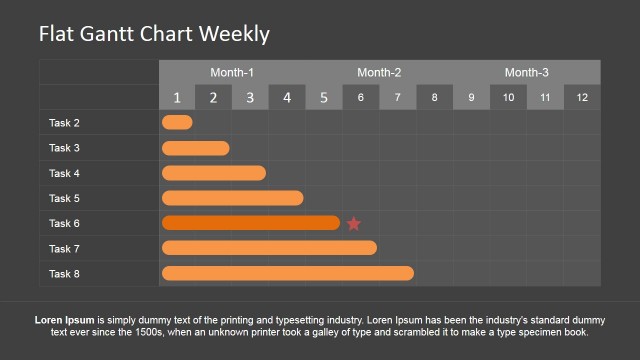
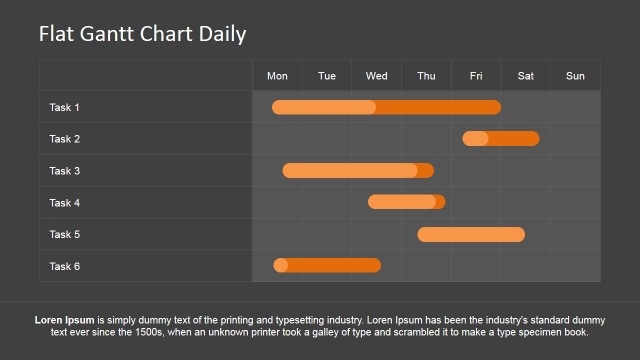
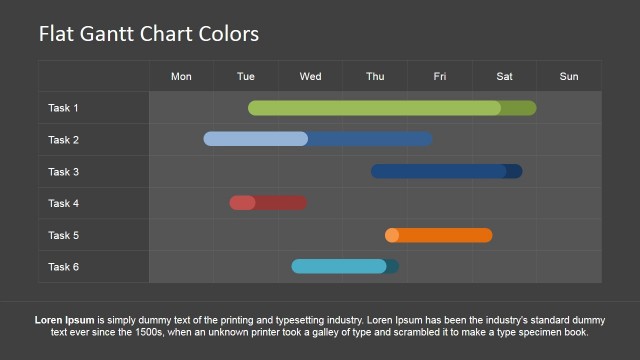
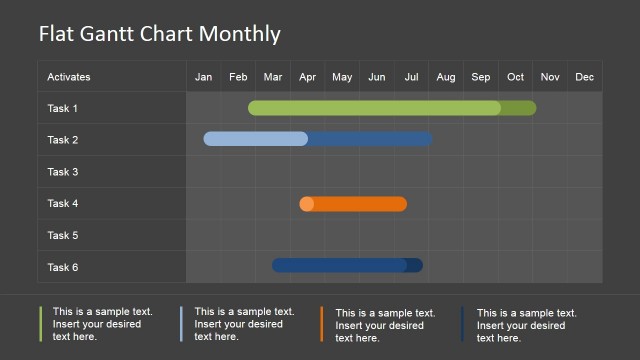
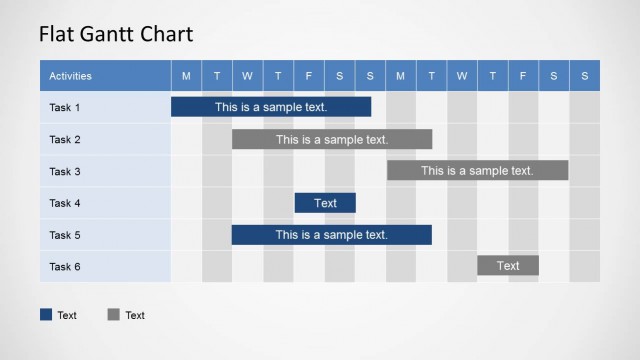
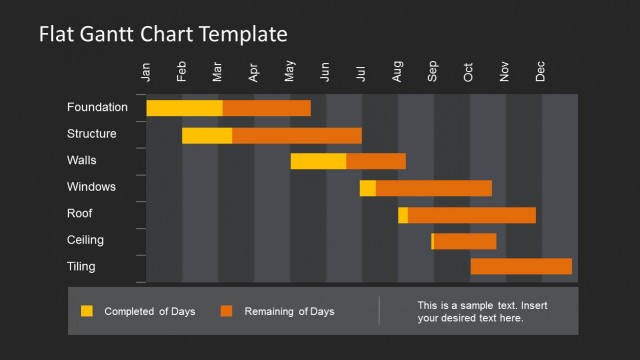
This slide features a Weekly Schedule Gantt chart for PowerPoint with six tasks and a weekly plan. The user can add new tasks (rows) or weeks (columns) by editing the PowerPoint Table. The tasks duration bars have different colours so they can be easily distinguished from each other. They contain colours such as green, blue, red, orange, and blue green. The PowerPoint objects are 100% customizable to suit the presenter’s needs and preferences.
The Gantt chart can be used in the presentation of project management plans. In this aspect, it is designed to show the schedule assigned and actualized for each specific task in the project. This ensures that the tasks are completed efficiently, and allows the manager to keep track of each progress.
Return to Editable Gantt Chart for PowerPoint.
Download unlimited PowerPoint templates, charts and graphics for your presentations with our annual plan.
DOWNLOADReturn to Editable Gantt Chart for PowerPoint.
