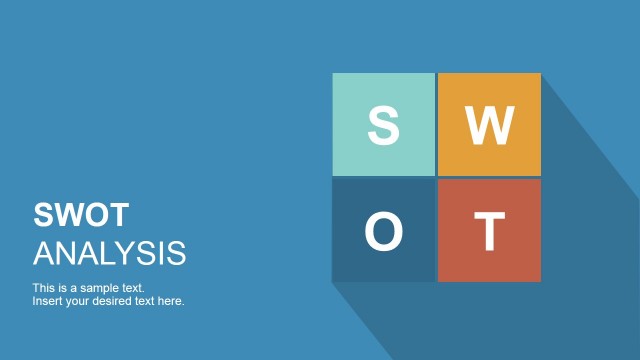
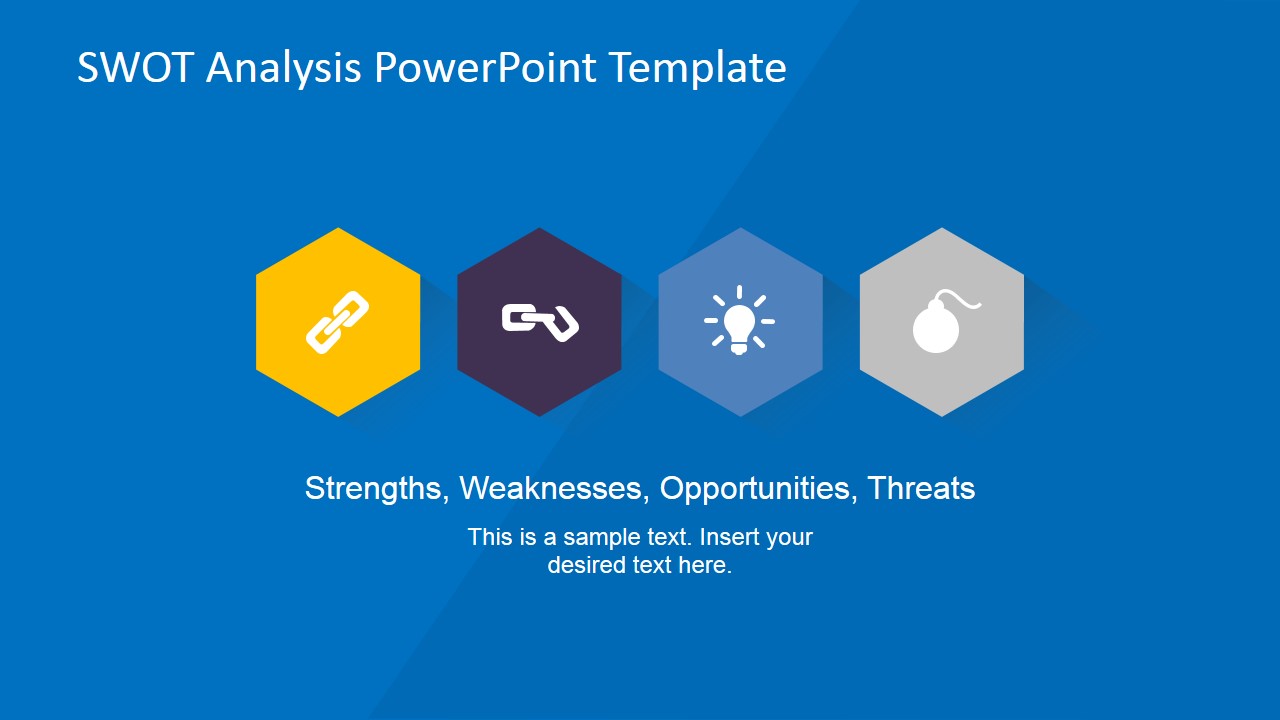
Creative SWOT Flat Design Diagram for PowerPoint
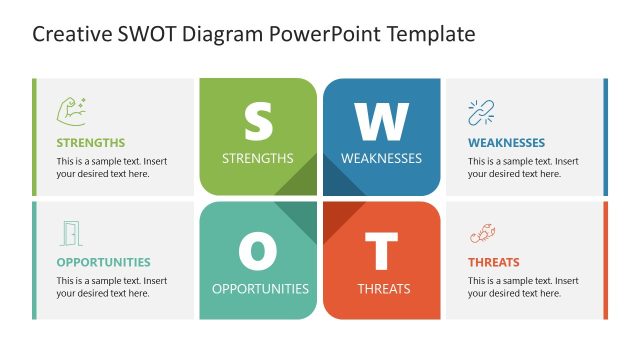
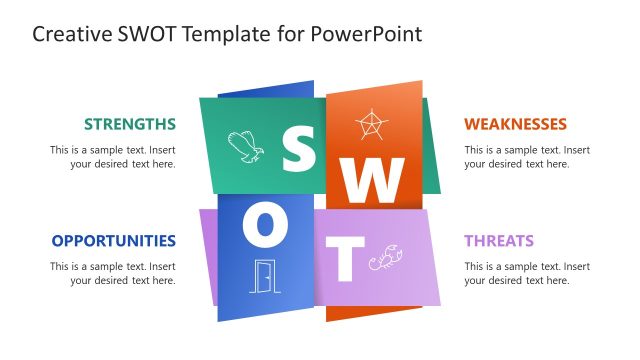
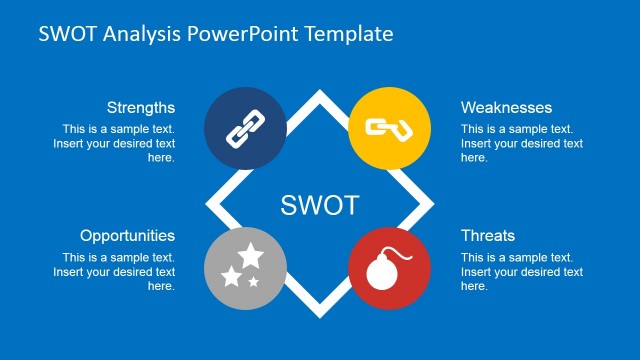
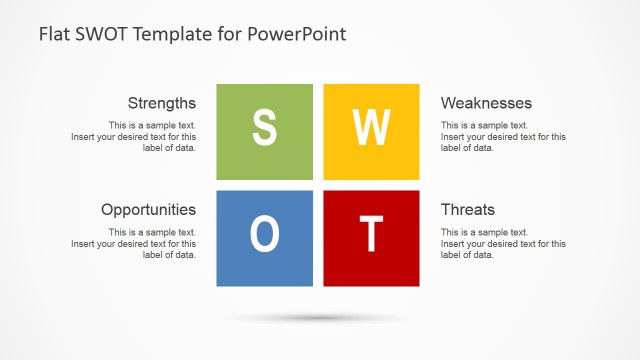
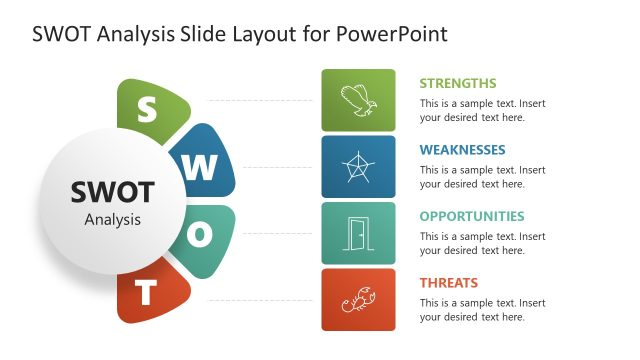
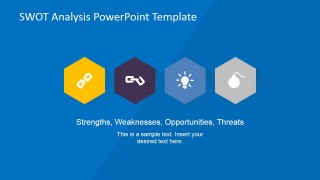
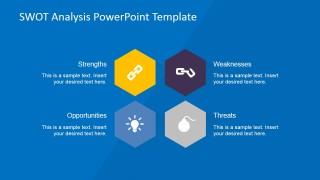
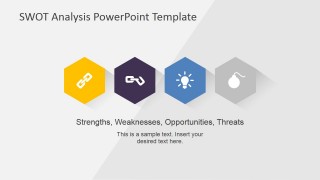
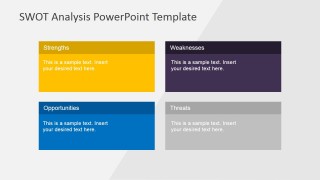
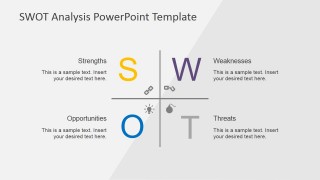
Creative SWOT Flat Design Diagram for PowerPoint – This creative SWOT Flat Design Diagram for PowerPoint is a professionally designed template that assists a presenter in conveying a SWOT presentation perfect for audiences in a business setting. The SWOT analysis template contains the basic principles of the SWOT analysis. Its principles are mainly based on identifying a business or non-business entity’s Strengths, Weaknesses, Opportunities and Threats. This design allows the presenter to formulate several different approaches in presenting a SWOT analysis for its company, investors, project or teams. The presenter can use readily available icons to represents the aspects that compose a SWOT analysis. Each part of the presentation can be elaborated in separate slides using their corresponding icons or using photos that exclusively represent the company.
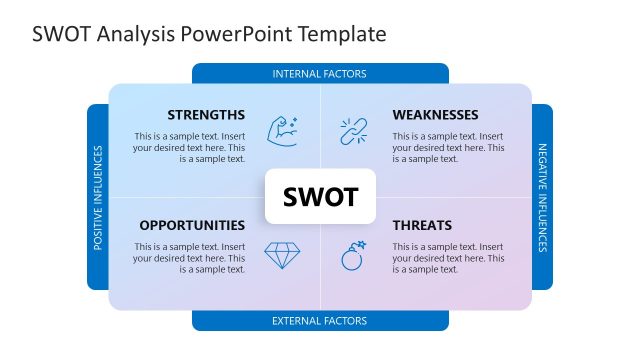
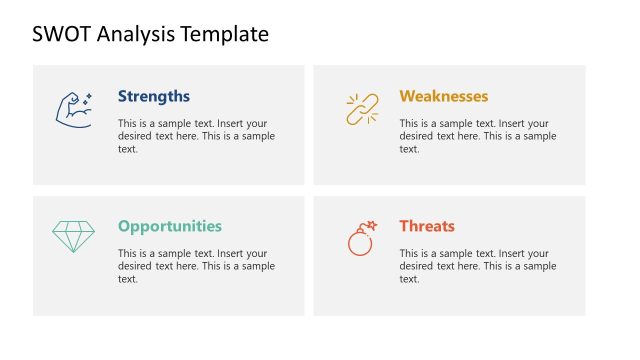
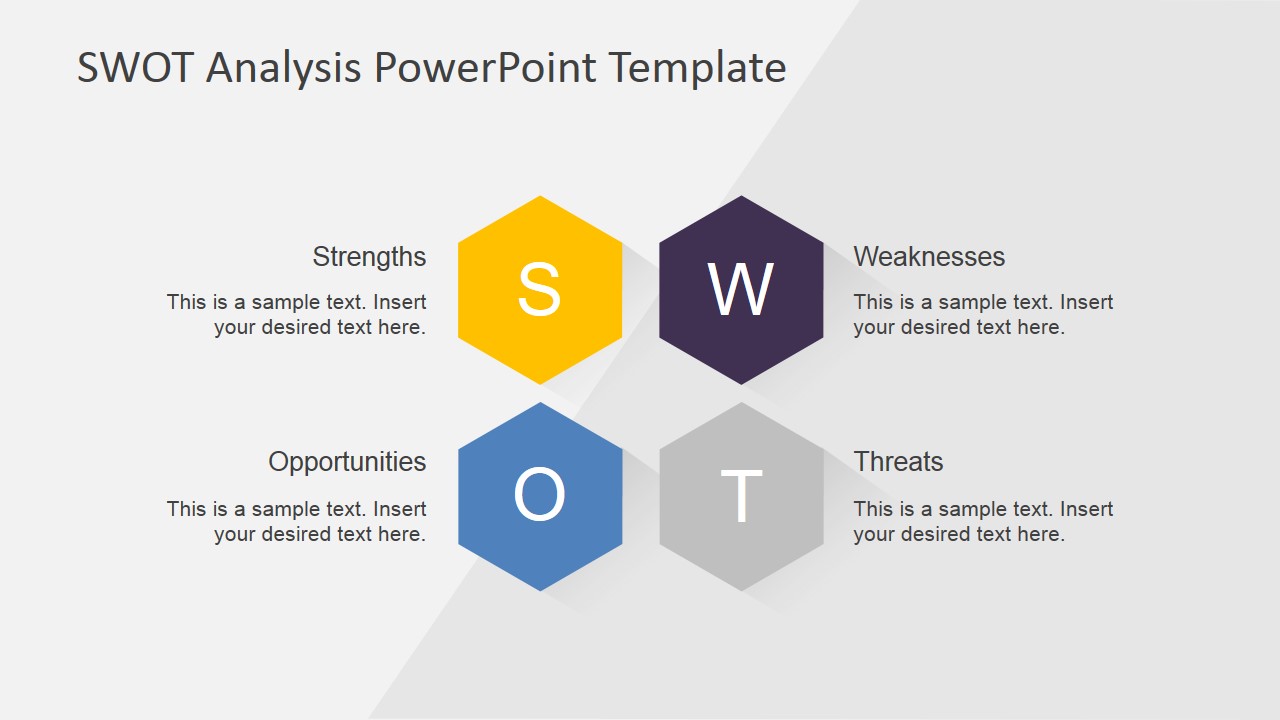
SWOT analysis is widely used as a decision making tool in establishing relevant actions to improve a business entity’s current status. This type of analysis is divided into two main considerations: internal and external influences. The internal influences are those that the business entity can control – those that are within the organization. This internal influence is then sub-categorized into two. The sub-categories are the company’s Strengths and Weaknesses. Examples of these are its assets and liabilities; employee skills or competencies and their areas of improvement; customer satisfaction and dissatisfaction rates; profit and loss. On the other hand, SWOT analysis also determines the company’s external factors or those that are not directly controlled by the company. They are the Opportunities and Threats. These factors are found outside of the organization but highly affect the company’s status. Examples of these are the company’s market share versus its competitor’s; prevailing rate versus the company’s current liabilities; industry’s peak season and the company’s production rate. Once these factors are identified using the SWOT analysis, the managers can decide which one these factors is of highest priority. The team will then make a line-up of activities to take advantage of the data derived from the analysis.


You must be logged in to download this file.
DOWNLOAD- Category
- Strategy
- Rating


 Loading...
- Size
- 16x94x3
- Item ID
- 6643-02
- Colors
Subscribe today and get immediate
access to download our PowerPoint templates.