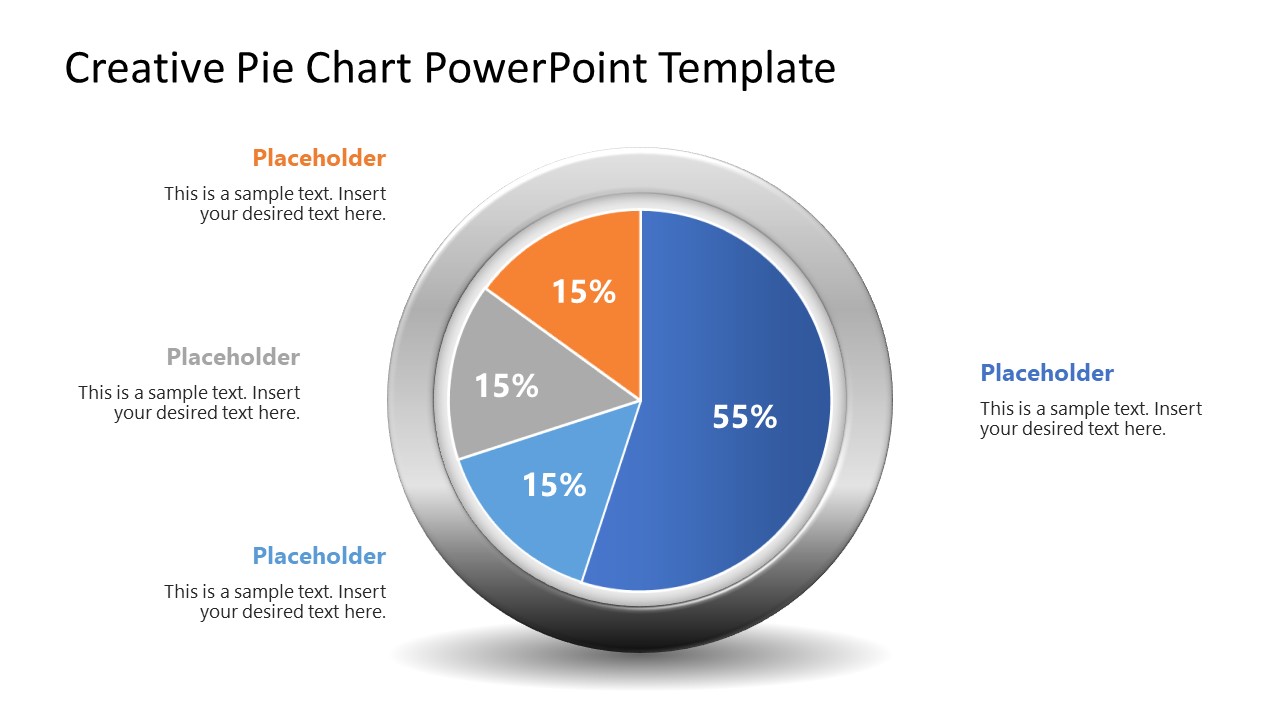
Creative Pie Chart PowerPoint Template
Showcase your distribution of retail products across various categories with our Creative Pie Chart PowerPoint Template. Data visualizations summarize complex data and organize it into multiple formats, enabling stakeholders to identify trends and insights that inform their decisions. Professionals use various types of data charts based on their datasets, such as bar charts, line charts, pie charts, dot plots, and area charts. We have designed this template with a creative pie chart showing a double concentric circle outline. The pie chart has four segments of varying sizes based on the percentage values being presented. With each pie section, there is placeholder text for the title and description, allowing the data expert to display the relevant information in an effective style. The template features fully editable PowerPoint elements that users can customize according to their specific needs.
The Creative Pie Chart PowerPoint Template only has a single slide with customizable elements. You can modify the fonts, shapes, and chart type to suit your needs perfectly. Finance professionals can present their budget allocation to various departments clearly and understandably. Students and researchers can use this template to showcase their biology, chemistry, or physics research outcomes with the pie diagram. Marketers can discuss the budgeting strategies for advertising campaigns in their marketing sessions. Moreover, they can present the market share of different competitors with this diagram. Sales executives can use this pie chart diagram template to illustrate the breakdown of sales by item in the store. Teachers can use this template to present the time allocation to different subjects or topics in the course outline. Download the creative pie chart PPT template and edit it to showcase your research datasets comprehensively!

You must be logged in to download this file.
DOWNLOAD- Category
- Data & Charts
- Rating

 Loading...
- Size
- 16x9
- Item ID
- 23215-01
- Colors
Subscribe today and get immediate
access to download our PowerPoint templates.