Slide 10 of 12 from Corporate Vision PowerPoint Template
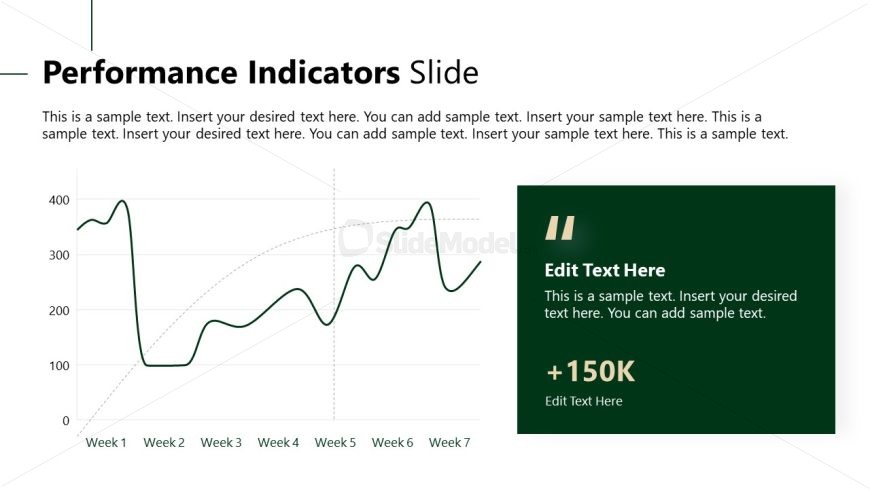
Performance Indicators Slide with Line Chart
Performance Indicators Slide for Business Presentations
- Chart
- Line Chart
- Evaluation Slide
- 16:9
- 100% Editable
The Performance Indicators Chart slide from the Corporate Vision PowerPoint Template offers a clear line chart layout ideal for business presentation reviews and project updates. This slide template supports data-driven discussions by highlighting key performance metrics with editable shapes and text placeholders, making it suitable for corporate presentations and pitch deck templates.
What’s on This Slide
The layout features a line chart positioned centrally, displaying performance data over seven weeks. The x-axis is labeled with week numbers, while the y-axis indicates performance values. Above the chart, there is a title placeholder aligned to the left. To the right, a text box contains a highlighted statistic with a green background, including a subtext area for additional details. Text placeholders are present, allowing for custom content. The overall layout emphasizes the chart, with a clean and organized structure.
How to Use It
This layout serves to present performance metrics in a clear and concise manner. It fits well after problem identification slides, transitioning into data-driven discussions. Ideal for business reviews, project updates, or performance assessments, it allows for effective communication of trends and key statistics. The visual hierarchy supports easy interpretation of data, making it suitable for both internal and external presentations.
Text Placeholders & Capacity
Keep your copy within these limits so it fits without resizing. Text slots are ample, accommodating detailed descriptions.
| Placeholder | Count | Max characters (approx.) |
|---|---|---|
| Slide title | 1 | 30 |
| Body paragraph | 4 | 150 |
| Item body | 1 | 50 |
| Item heading | 1 | 10 |
Slide Keywords
Download unlimited PowerPoint templates, charts and graphics for your presentations with our annual plan.
DOWNLOADReturn to Corporate Vision PowerPoint Template.