Slide 13 of 15 from Corporate Identity PowerPoint Template
Editable Market Size Graphic for Corporate Identity Design
Market Size Visualization Slide
- Diagram
- Other
- Context Slide
- 16:9
- 100% Editable
The Market Size Visualization slide from the Corporate Identity PowerPoint Template offers a clear diagrammatic approach to presenting hierarchical market data. This slide layout uses concentric circles with editable shapes and vector icons to highlight key market size metrics, making it suitable for business presentations, investment pitches, and market analysis reports. Its design supports effective communication of market potential within professional slide decks.
What’s on This Slide
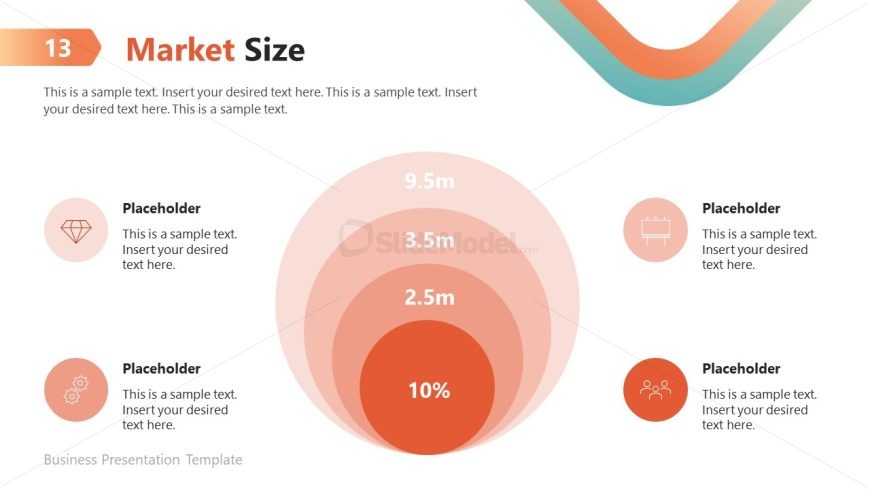
The layout features a central circular diagram with four concentric circles, each representing different market size metrics. The largest circle at the top displays '9.5m', followed by '3.5m' and '2.5m', with the innermost circle labeled '10%'. Each circle has a light gradient color, transitioning from light to dark red. To the left, there are two icon placeholders, one for a diamond and another for gears, accompanied by text placeholders aligned vertically. The title is positioned at the top left, and a footer is present at the bottom.
How to Use It
This layout serves to illustrate market size data effectively, making it suitable for presentations focused on business analysis or market research. It fits well after problem or analysis slides, providing a visual summary of market potential. Ideal scenarios include investor pitches, business strategy meetings, or market assessment reports. The concentric circles allow for a clear representation of hierarchical data, emphasizing the most significant figures.
Text Placeholders & Capacity
Keep your copy within these limits so it fits without resizing. Body slots can accommodate roughly 15-20 words each.
| Placeholder | Count | Max characters (approx.) |
|---|---|---|
| Slide title | 1 | 20 |
| Item heading | 4 | 10 |
| Body paragraph | 4 | 100 |
| Footer | 1 | 30 |
Slide Keywords
Download unlimited PowerPoint templates, charts and graphics for your presentations with our annual plan.
DOWNLOADReturn to Corporate Identity PowerPoint Template.


