Slide 3 of 10 from Corporate Annual Meeting PowerPoint Template
Financial Performance Slide with Data Chart
Financial Performance Chart for Corporate Meetings
- Chart
- Line Chart
- Financial Summary Slide
- 16:9
- 100% Editable
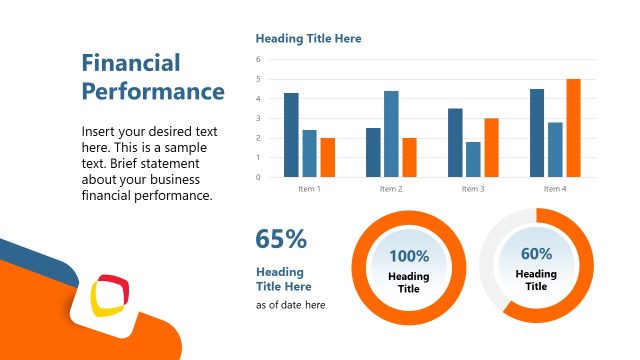
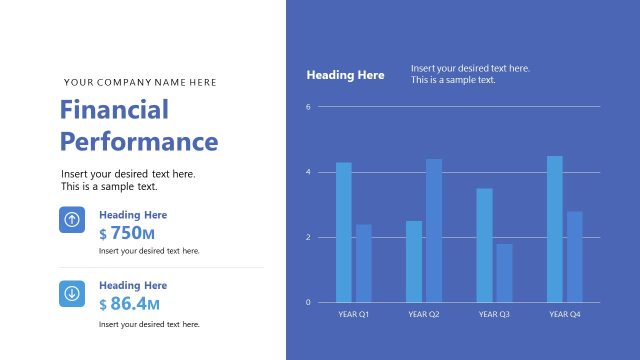
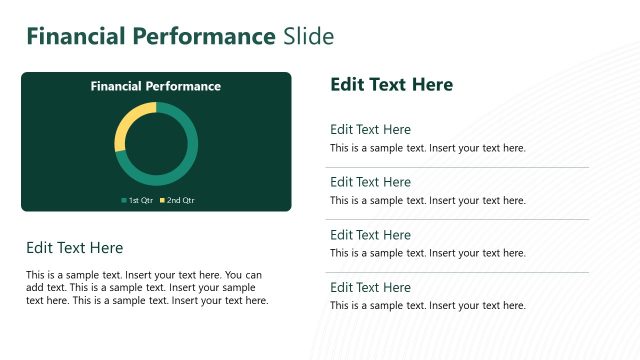
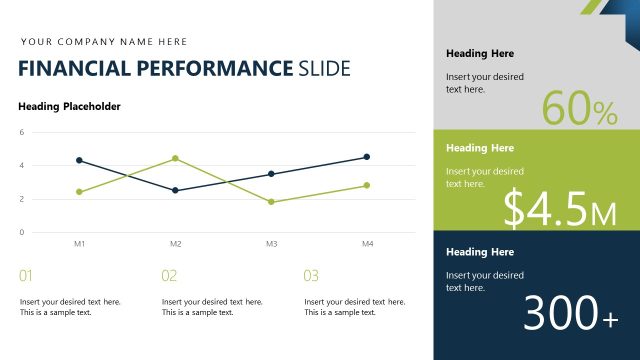
The Financial Performance Chart slide from the Corporate Annual Meeting PowerPoint Template offers a clear line chart layout ideal for business presentation templates focused on financial summaries. This editable slide highlights key performance metrics with vector icons and numerical labels, making it suitable for annual financial reviews and budget performance analysis within a corporate presentation or pitch deck template.
What’s on This Slide
The slide features a line chart depicting financial performance over time. The chart is positioned centrally, with a smooth curve representing data points. The left side includes numerical labels ranging from 30 to 100, indicating performance metrics. A prominent percentage value of 87.6% is displayed in a large font, centered within the chart. Text placeholders are located at the top and bottom, aligned left and centered, respectively, allowing for additional context. The background is a soft beige, enhancing visibility without distraction.
How to Use It
This layout serves as a performance overview, ideal for presenting financial metrics in a corporate setting. It fits well after problem-framing slides, providing a clear visual representation of progress. Use it to discuss annual performance, budget reviews, or strategic planning. The layout is effective for summarizing key financial data, making it suitable for board meetings or stakeholder presentations. It emphasizes key performance indicators and can be adapted for various financial contexts.
Text Placeholders & Capacity
Keep your copy within these limits so it fits without resizing. Body slots can accommodate roughly 10-15 words each.
| Placeholder | Count | Max characters (approx.) |
|---|---|---|
| Slide title | 1 | 30 |
| Body paragraph | 3 | 100 |
| Item body | 1 | 10 |
Slide Keywords
Download unlimited PowerPoint templates, charts and graphics for your presentations with our annual plan.
DOWNLOADReturn to Corporate Annual Meeting PowerPoint Template.