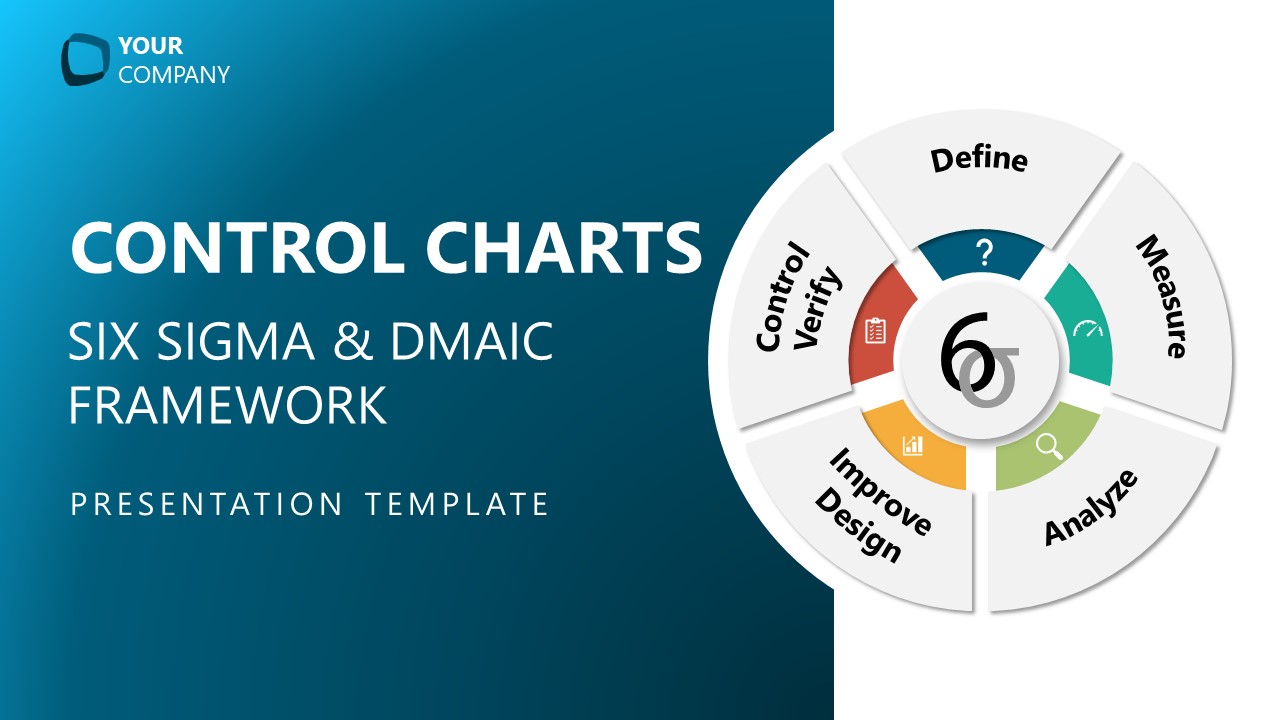
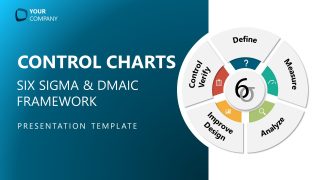
Control Charts PowerPoint Template
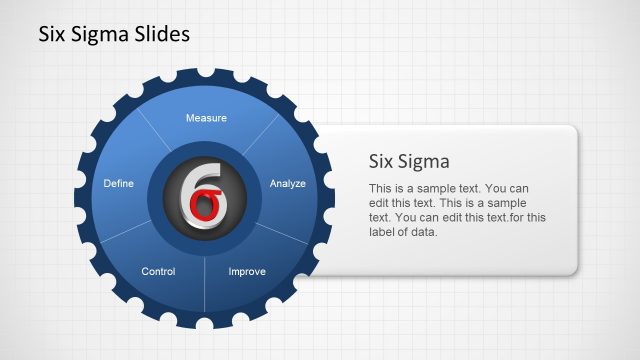
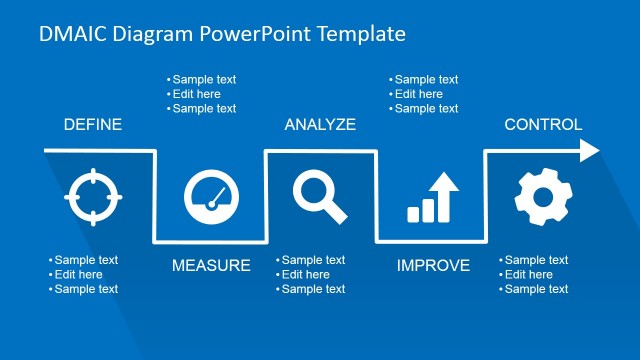
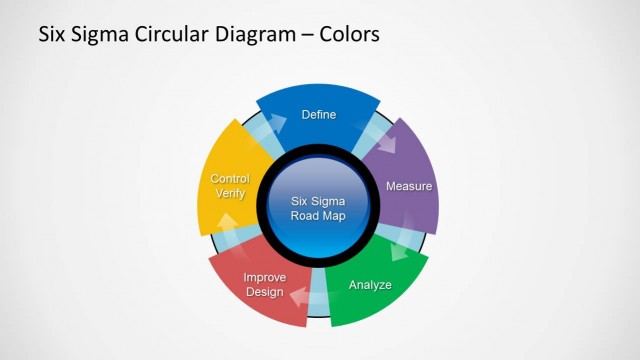
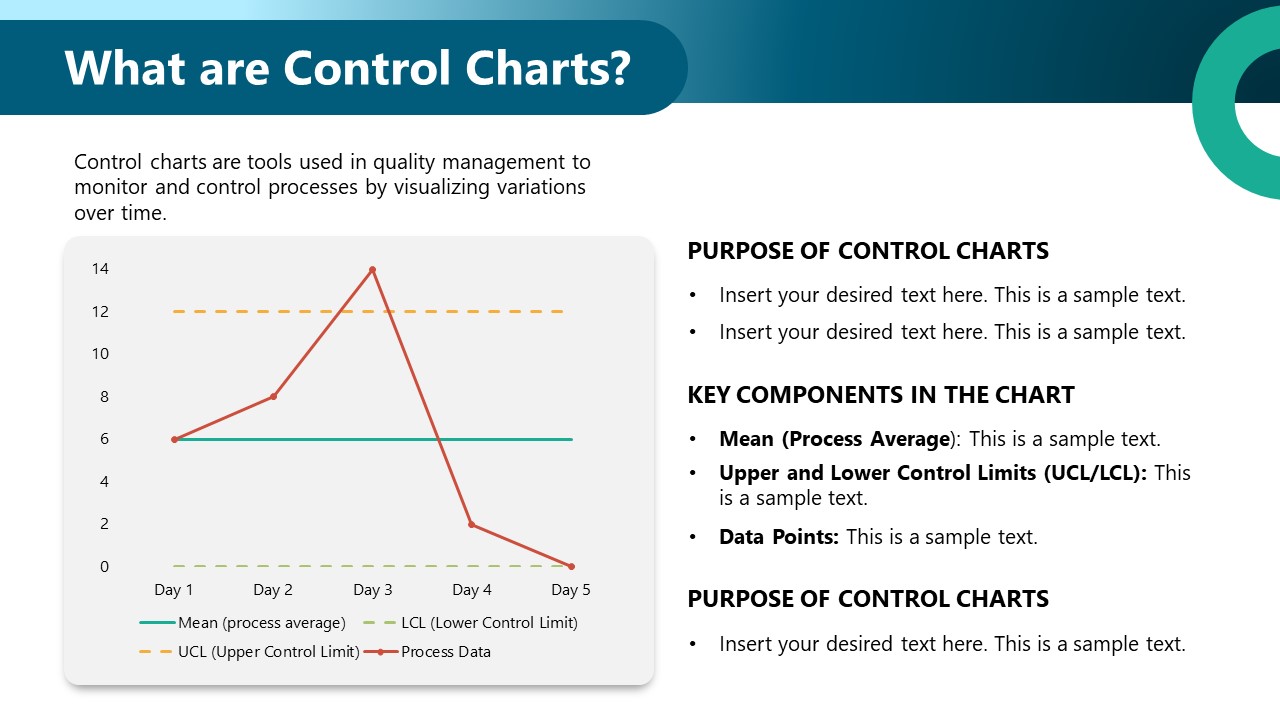
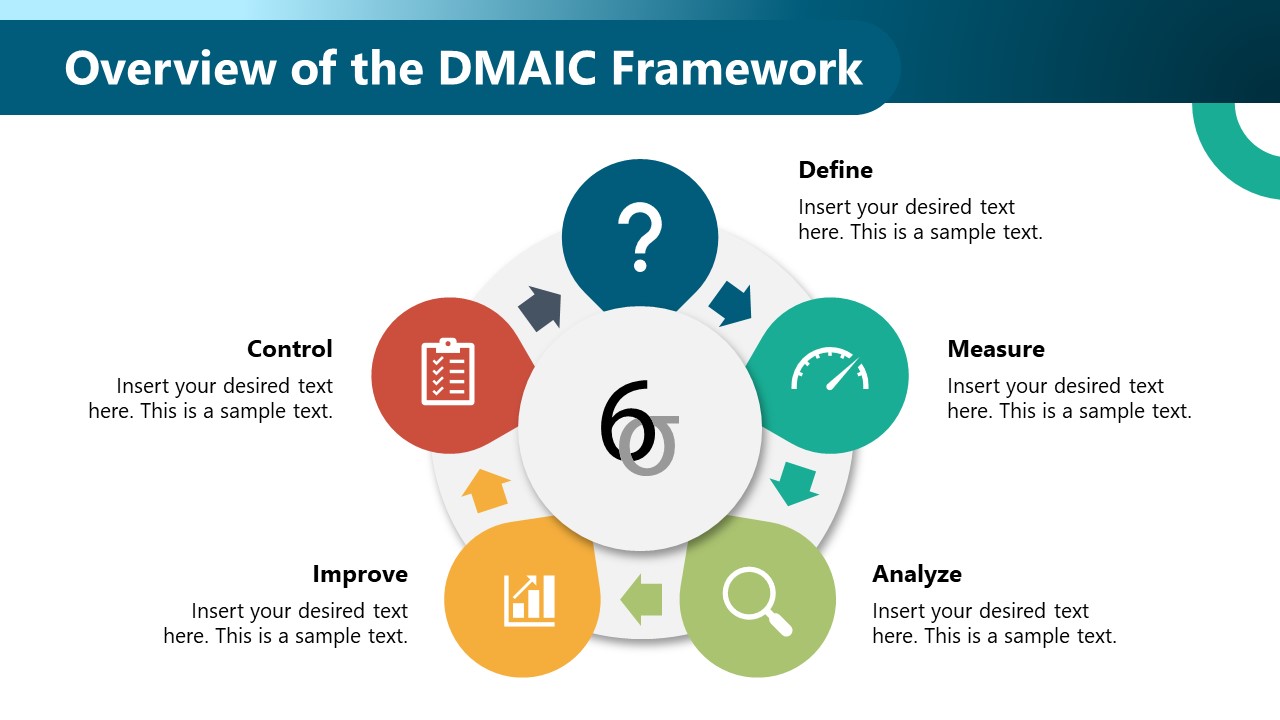
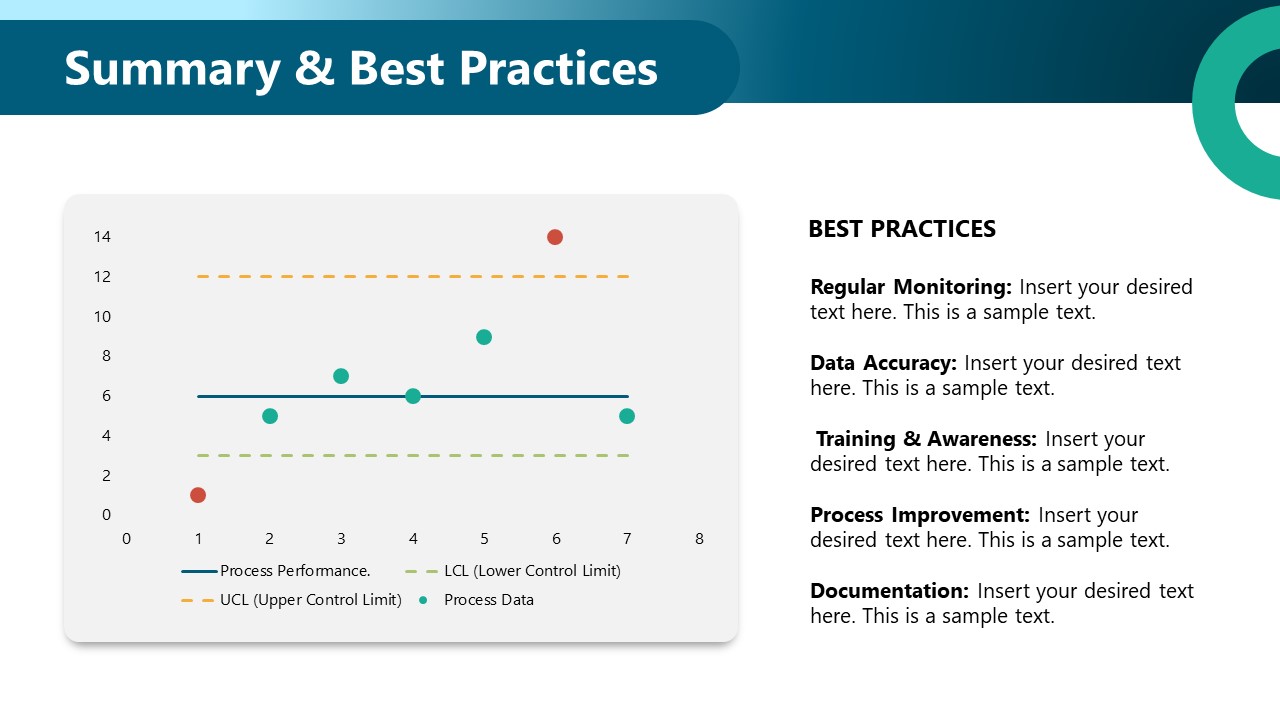
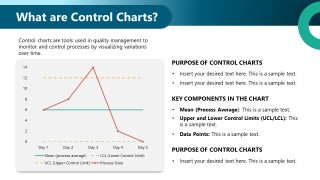
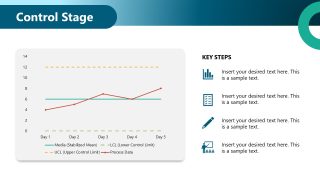
Present your Six Sigma strategy and control charts with our easy-to-customize Control Charts PowerPoint Template. In Six Sigma, the control chart is a graphical tool used to analyze and understand the process stability over time. This chart tracks multiple data points recorded with time and compares them to a standard stability line. It enables the professionals to estimate how processes are operating and which areas require improvement. In this PPT template, we provided an editable slide with a demo control chart diagram to help discuss its components, such as Mean, UCL/LCL, and Data Points. It can be used for discussions with teams or stakeholders or for training purposes about its significance in process improvement. Next to the slide for control charts, this PPT template has a diagram slide with a core element showing the Six Sigma symbol and the surrounding segments indicating the DMAIC framework points.
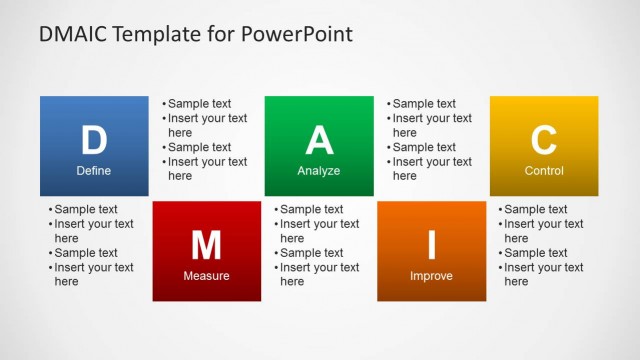
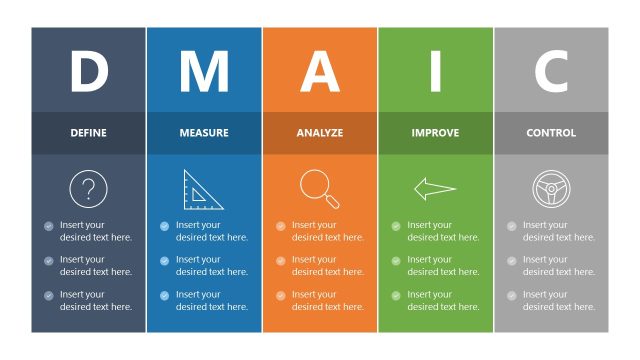
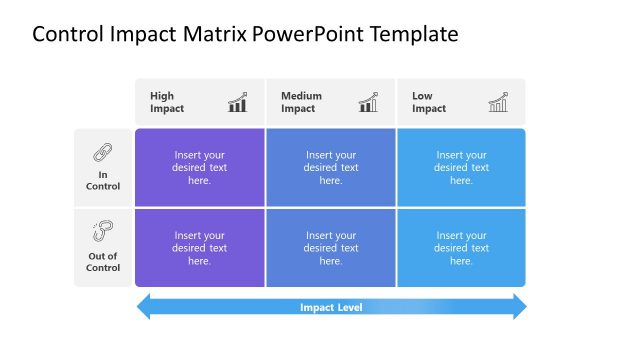
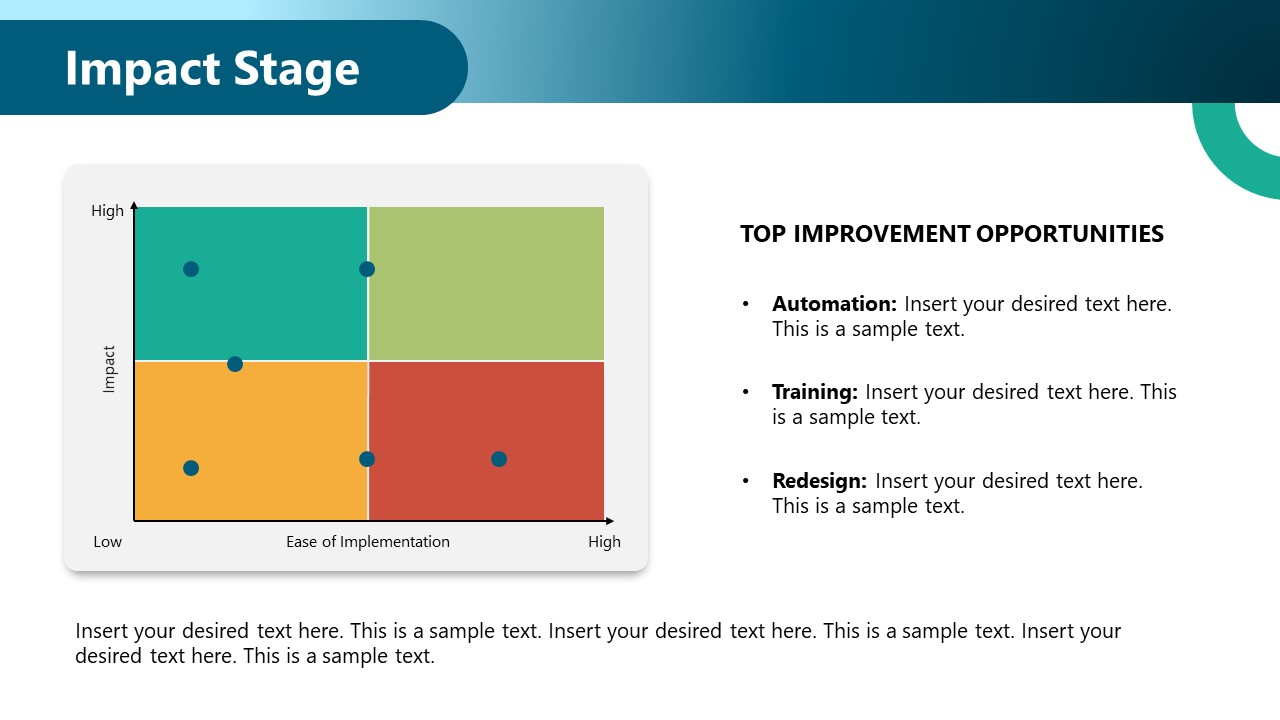
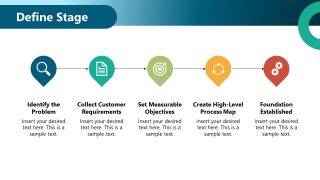
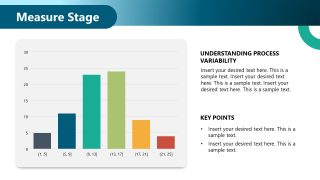
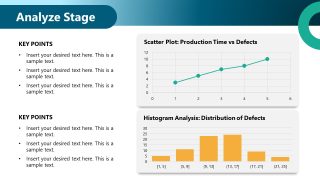
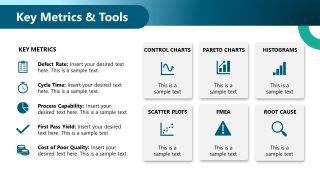
This Control Charts PowerPoint Template features individual slides for presenting the DMAIC (process improvement framework), i.e., Define, Measure, Analyze, Impact, and Control. The individual slides carry figures and charts relevant to the title. For instance, the define slide has a process diagram, the measure stage slide has a graph, the analyze slide has data-driven charts with text boxes, and the impact stage slide has a four-quadrant diagram for cause-effect analysis presentation. Likewise, the control stage slide and the one showing key metrics have graphs and meaningful symbols about various parameters.
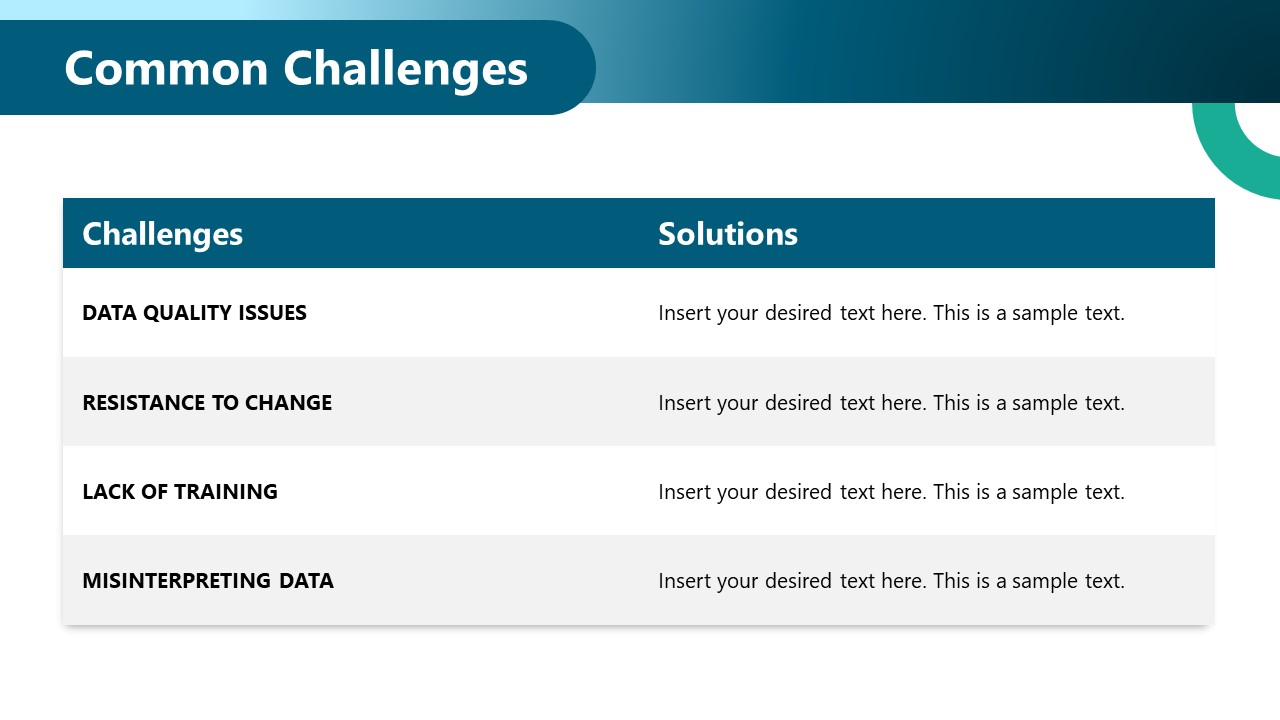
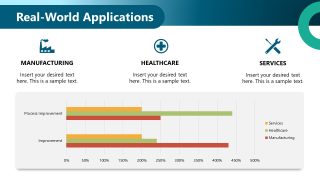
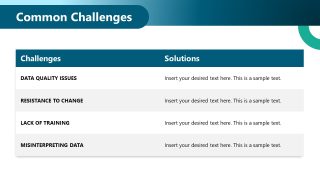
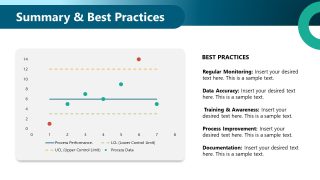
Further, this creative slide deck has slides to present the potential applications of DMAIC in the healthcare and manufacturing sectors, common challenges, and summary/best practices. Presenters can edit this PPT template’s fonts, backgrounds, color schemes, and figures and make it fit their requirements. So, download and edit this comprehensive slide deck for your Six Sigma and DMAIC presentations!


You must be logged in to download this file.
DOWNLOAD- Category
- Data & Charts
- Rating

 Loading...
- Size
- 16x9
- Item ID
- 94037-01
- Colors
Subscribe today and get immediate
access to download our PowerPoint templates.