Data-Driven Bar Chart Slide for Statistical Data Presentation
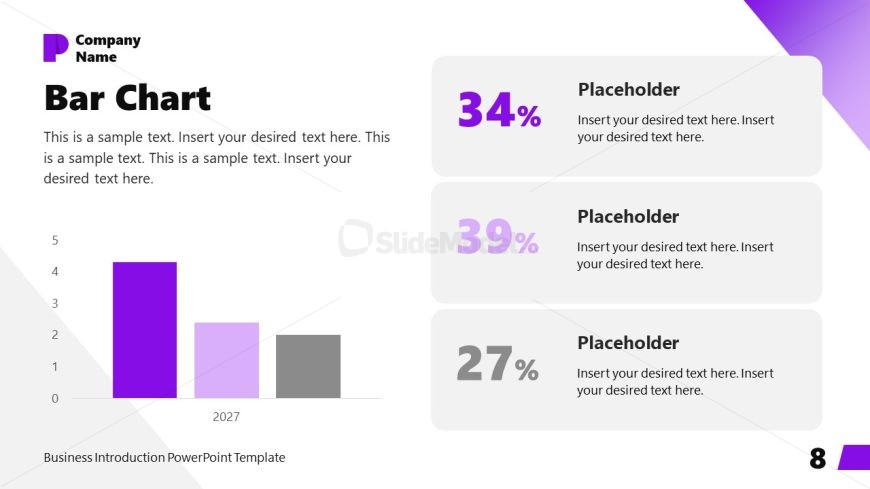
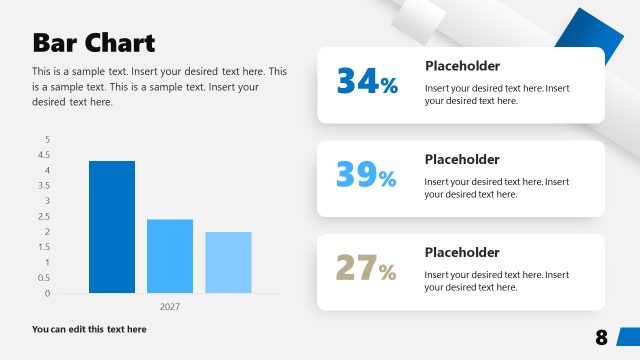
The image showcases a PowerPoint slide titled “Bar Chart” which is part of a business introduction template set. The slide features a mix of graphical data representation and text placeholders, utilizing a color scheme of purple, gray, and white that echoes the branding elements found in the top left corner where the “Company Name” is placed.
In the slide’s main section, a bar chart graph is displayed with three vertical bars of varying heights, representing different numerical values or categories, against an axis labeled with the year “2027”. The tallest bar is colored in the template’s signature purple, drawing attention as the primary data point. The other bars are shaded in lighter purple and gray, indicating secondary data.
To the right of the bar chart, three large percentages – 34%, 39%, and 27% – are showcased in bold, with each percentage placed next to its own text placeholder. These elements are presumably for explaining corresponding data points from the bar chart, and their size indicates their significance in the slide’s overall data presentation.
This slide is perfectly suited for business presentations where quantitative analysis is essential, such as sales performance, market research data, or financial results. The design allows for straightforward interpretation of data, making it beneficial for meetings with stakeholders, management teams, or potential investors where clear communication of data is crucial.
Return to Company Profile Overview PowerPoint Template.