Slide 6 of 6 from Communications Network Template with US Map for PowerPoint
6081-01-communications-network-us-map-6
Communications Network Metrics for PowerPoint
- Diagram
- Comparison Split
- Evaluation Slide
- 100% Editable
The Communications Network Metrics slide from the Communications Network Template with US Map for PowerPoint offers a clear visual comparison of broadcasting and service distribution metrics. This slide layout uses editable shapes and vector icons to present network performance data across different communication channels, making it suitable for business presentations and corporate slide decks focused on telecommunications analysis.
What’s on This Slide
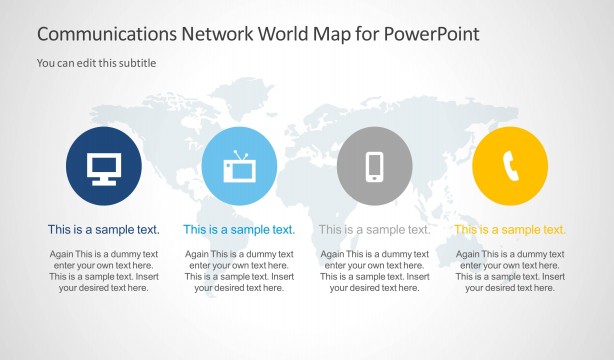
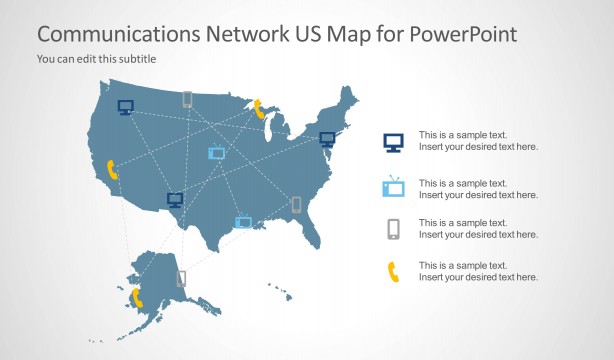
The layout features a US map in light gray as a background. At the top, a title placeholder is centered, with a subtitle placeholder directly below it. Four circular nodes are arranged horizontally across the slide, each containing an icon and a percentage value. The leftmost node is dark blue with a computer icon, followed by a light blue node with a TV icon, a gray node with a mobile phone icon, and a yellow node with a telephone icon. Each node is evenly sized and visually distinct, with clear spacing between them.
How to Use It
This layout serves as a metrics overview for communications networks, suitable for presenting data related to broadcasting, internet, mobile, and telephone services. It fits well in a presentation sequence after problem identification slides, providing a clear visual summary of performance metrics. This layout is useful for stakeholders needing to assess network coverage or service distribution across the US, enabling quick comparisons between different communication channels.
Text Placeholders & Capacity
Keep your copy within these limits so it fits without resizing. Node labels can accommodate short phrases, roughly 2-3 words each.
| Placeholder | Count | Max characters (approx.) |
|---|---|---|
| Slide title | 1 | 40 |
| Subtitle | 1 | 40 |
| Item heading | 4 | 10 |
| Item body | 4 | 5 |
Slide Keywords
Download unlimited PowerPoint templates, charts and graphics for your presentations with our annual plan.
DOWNLOADReturn to Communications Network Template with US Map for PowerPoint.