Financial Plan Data Charts Slide
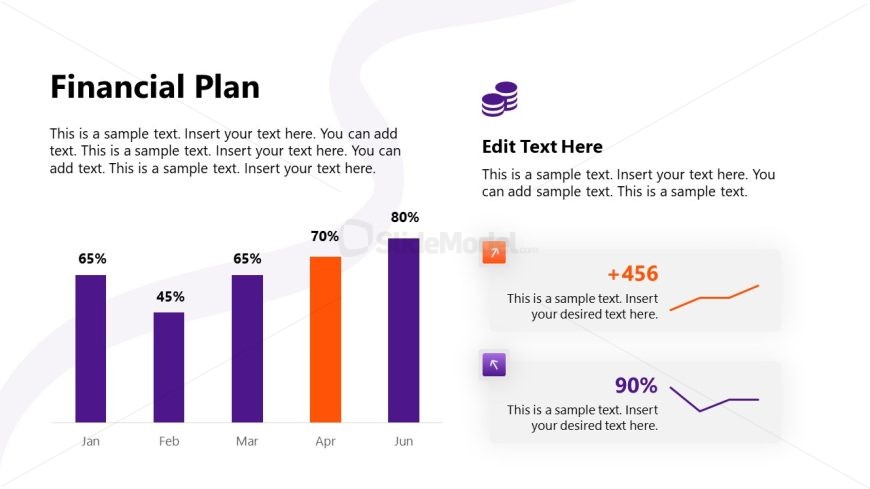
The Financial Plan Data Charts Slide Template is designed to illustrate financial projections and performance metrics in a visually compelling manner. Featuring a vibrant color scheme of purple and orange, this slide uses bar charts to display percentage growth over a timeline, allowing for easy comparison of data across months. The left side showcases a clear progression with bars representing values for each month from January to June, while the right side provides space for additional text or insights related to the financial plan.
This slide is perfect for presentations focused on financial analysis, project planning, or investment proposals. It can be customized to reflect specific data, making it a valuable tool for professionals in finance, marketing, and project management. The layout is clean and organized, with a linear arrangement of elements that guides the viewer’s eye from the charts to the accompanying text.
Included in the Commercial Project Plan PowerPoint Template, this Financial Plan slide allows you to effectively communicate your project’s financial health and growth potential. You can easily download this slide for PowerPoint and Google Slides presentations, ensuring your financial data is presented in an engaging and informative manner. Customize it to suit your needs and convey your message with clarity and impact.
Return to Commercial Project Plan PowerPoint Template.