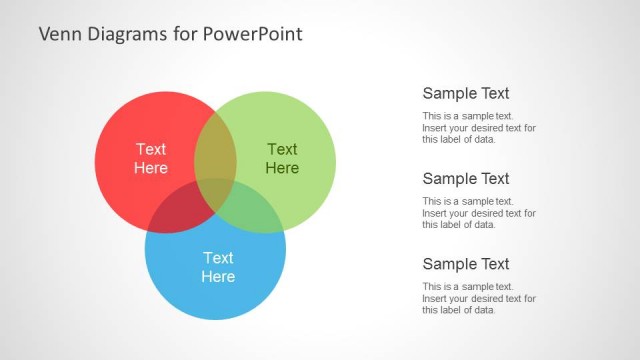
Slide 2 of 5 from Colorful Intersected Circles & Venn Diagrams for PowerPoint
8075-02-colorful-circle-diagram-2
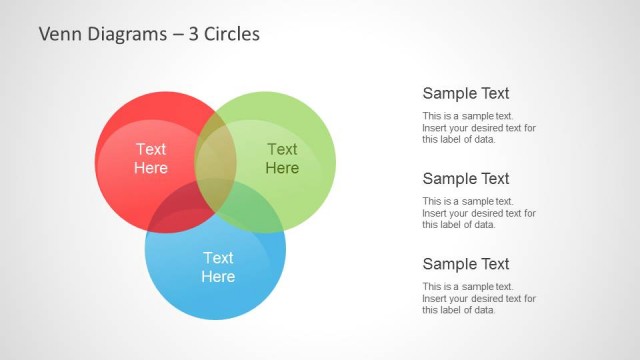
Intersection of Three Circles Diagram
- Diagram
- Venn
- Concept Explanation Slide
- 16:9
- 100% Editable
The Intersection - 3 Circles slide from the Colorful Intersected Circles & Venn Diagrams for PowerPoint template offers a clear visual for illustrating logical relationships and data overlaps. Ideal for strategic planning sessions and business presentations, this slide layout uses editable shapes and vector icons to highlight set intersections effectively within a professional slide deck.
What’s on This Slide
The layout features three intersecting circles arranged horizontally. The left circle is blue, the center circle is red, and the right circle is green. Each circle has a text placeholder centered within it, labeled 'Text Here.' Below the circles, there are two additional text placeholders aligned centrally, labeled 'Sample Text.' The overall composition emphasizes the overlaps between the circles, creating a visual representation of set intersections. The background is light, enhancing the visibility of the colored circles and text placeholders.
How to Use It
This layout serves as a visual tool for illustrating intersections among three sets. It is suitable for presentations discussing logical relationships, comparisons, or data overlaps. This slide can fit into a sequence following a problem statement, helping to clarify complex relationships. It is useful in business contexts such as market analysis, product comparisons, or strategic planning discussions, where understanding overlaps is crucial.
Text Placeholders & Capacity
Keep your copy within these limits so it fits without resizing. Node labels can hold short phrases, while body text slots can accommodate around 15-20 words each.
| Placeholder | Count | Max characters (approx.) |
|---|---|---|
| Slide title | 1 | 30 |
| Item heading | 3 | 10 |
| Body paragraph | 2 | 100 |
Slide Keywords
Download unlimited PowerPoint templates, charts and graphics for your presentations with our annual plan.
DOWNLOADReturn to Colorful Intersected Circles & Venn Diagrams for PowerPoint.