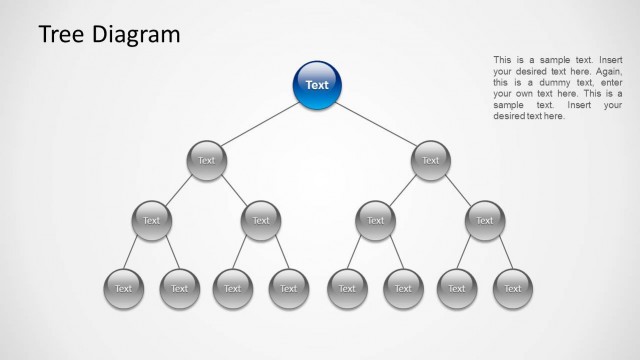
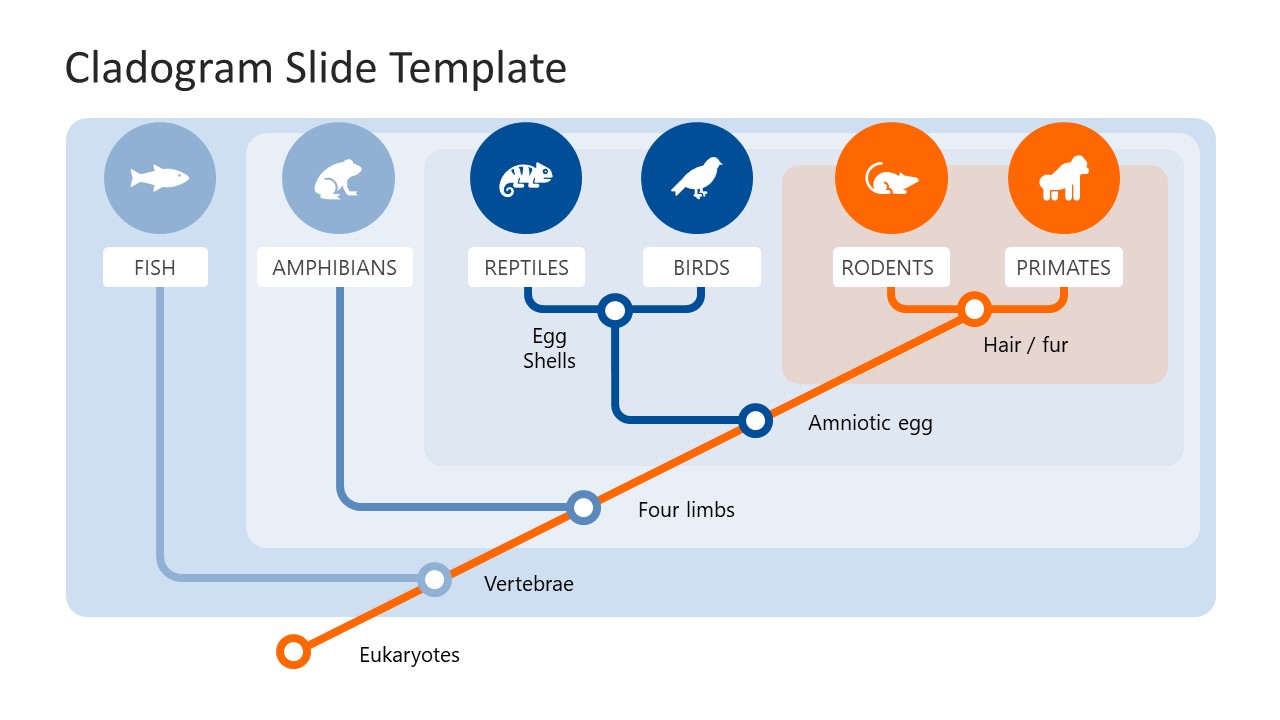
The Cladogram PowerPoint Template is a creative diagram showing the step-by-step arrangement of the species based on their common features and evolutionary relationship. Evolution is a common concept that refers to the gradual changes acquired in organisms over time that is manifested through the appearance of newer species on Earth. This process started billions of years ago and is continuing. Molecular geneticists or scientists who study the DNA or physiological similarities between the organisms perform the phylogenetic analysis to prepare the cladogram. A cladogram is a tree diagram showing the evolution of the organisms from a common ancestor and representing the ancestors at several points represented as nodes. The nodes are indicated by a specie that acquired additional characters to form another organism’s group. This best PPT template shows the cladogram of eukaryotes, starting from the invertebrates to highly specialized primates.
This Cladogram PowerPoint Template is a diagonal tree diagram beginning from eukaryotes’ root node (common ancestor). It includes the organisms such as invertebrates that got vertebrae after years and gave rise to the fishes, which further acquired the four limbs to show up as amphibians. On the lower side of this diagonal line, these characters are mentioned step-wise, while on the other side, the specific groups are mentioned with diagrams of representative organisms. The first slide shows an alternative grey and white shading, while the second slide color highlights each class using distinct color shades which are more prominent. Presenters can add or remove certain words or mention them according to their choice. Likewise, they can add the organism illustrations of their choice. These PowerPoint slides are exceptionally engaging for educational sessions. It can help coaches demonstrate the creation of a cladogram or ancestral hierarchy of the organisms. It can be read in both directions, i.e., from top to bottom based on the similarities and from bottom to top based on dissimilarities. So, download and use this creative cladogram template for your professional and educational presentations!
What’s inside this template
Example presentation scenarios
- A biology teacher can use the diagonal cladogram to explain how fish, amphibians, reptiles, birds, rodents, and primates relate through shared traits.
- A genetics lecturer can use the trait nodes to introduce phylogenetic analysis and show how common ancestry is inferred from observable features.
- A science curriculum designer can use the colored band version to build a lesson slide that separates organism groups while keeping the evolutionary sequence visible.
- A student presenter can use the gray shaded version to summarize a cladistics assignment with concise labels and editable text callouts.
Features
- 100% editable presentation template
- Compatible with Microsoft PowerPoint and Google Slides
- 16:9 aspect ratio slides
- Scalable vector shapes, icons and illustrations
- AI-Ready for Microsoft Copilot and Claude
- Instant access and download
Frequently asked questions
Q: How should a presenter explain the cladogram without overwhelming students?
A: Start at the eukaryotes root and move along the orange diagonal branch one trait at a time. Pause at each node, then connect the trait to the organism labels above it. This keeps the audience focused on ancestry and shared characteristics rather than trying to interpret every branch at once.
Q: Who is this template best suited for?
A: This template is best for biology teachers, genetics lecturers, and student presenters who need to explain a cladogram quickly. The visible organism icons and short trait labels make it useful for an introductory lecture, a classroom review, or an academic summary where the goal is conceptual understanding.
Q: Why does the diagonal tree metaphor work for evolutionary relationships?
A: The diagonal branch acts as a timeline of derived traits, while the vertical branches separate organism groups that share earlier characteristics. That tree metaphor helps the audience see common ancestry, divergence, and trait accumulation in one view. The colored version also makes group boundaries easier to discuss.

Cladogram PowerPoint Template
2-slide presentation template for cladogram tree diagrams, evolutionary traits, and biology instruction
The Cladogram PowerPoint Template is a 2-slide diagram template for explaining evolutionary relationships. It includes a diagonal cladogram, branching trait nodes, organism icon labels, and shaded grouping bands for fish, amphibians, reptiles, birds, rodents, and primates. It is designed for educators, biology presenters, and genetics discussions in PowerPoint and Google Slides.
- Category
- Tree Diagrams
- Rating

 Loading...
- Aspect ratio
- 16:9
- Item ID
- 22006-01
- Colors
 Microsoft PowerPoint
 Microsoft Copilot
 Claude for PowerPoint
Other formats supported
Subscribe today and get immediate
access to download our PowerPoint templates.