Slide 10 of 12 from Business Strategy Overview PowerPoint Template
KPIs and Success Metrics Donut Chart PPT Slide
KPI and Success Metrics Overview Slide
- Chart
- Bar Vertical
- Kpi Reporting Slide
- 16:9
- 100% Editable
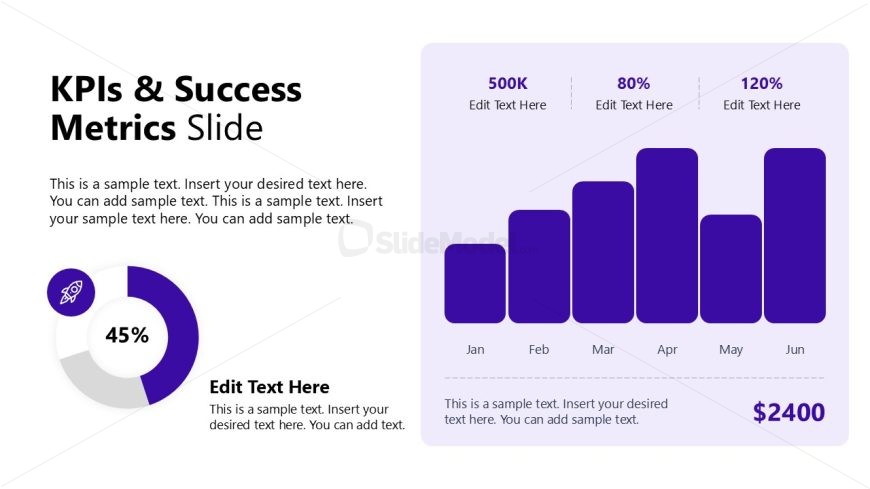
The KPIs & Success Metrics Slide from the Business Strategy Overview PowerPoint Template offers a clear visual layout combining a circular gauge and bar chart to effectively communicate key performance indicators. This slide template is ideal for business presentations focusing on quarterly performance reviews, sales metrics, or strategic planning, utilizing editable shapes and vector icons for precise data visualization within corporate presentation slide decks.
What’s on This Slide
The layout features a left-aligned circular gauge displaying a percentage value of 45%. To the right, a bar chart spans the upper section, showing monthly data from January to June with varying heights. Each bar is labeled with corresponding values, and the chart has a light purple background. Below the chart, there are multiple text placeholders for descriptions and additional metrics, aligned left. The overall composition is balanced, with a clear visual hierarchy emphasizing the gauge and bar chart.
How to Use It
This layout serves as a performance metrics overview, ideal for presenting key performance indicators in a business context. It fits well after problem framing slides, providing a quantitative analysis of success metrics. This structure is useful for quarterly reviews, strategic planning sessions, or sales performance reports, where visual data representation is essential for stakeholder understanding.
Text Placeholders & Capacity
Keep your copy within these limits so it fits without resizing. Body slots are tight, roughly 15-20 words each.
| Placeholder | Count | Max characters (approx.) |
|---|---|---|
| Slide title | 1 | 30 |
| Body paragraph | 4 | 100 |
| Item heading | 6 | 10 |
| Item body | 1 | 50 |
| Kpi value | 1 | 10 |
Slide Keywords
Download unlimited PowerPoint templates, charts and graphics for your presentations with our annual plan.
DOWNLOAD