Data-Driven Bar Chart Slide for Business Stats Presentation
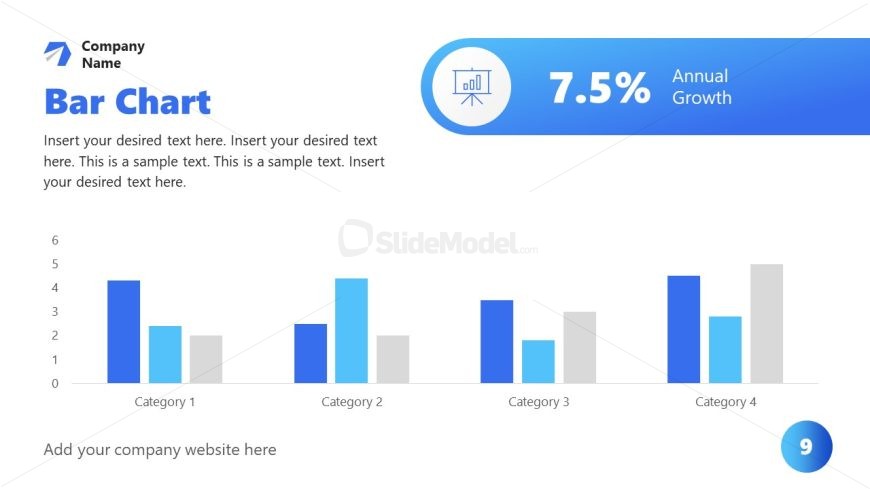
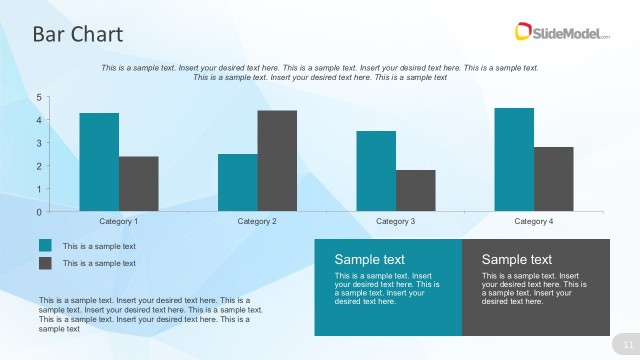
The image showcases a PowerPoint slide from a business presentation template, titled “Bar Chart.” The slide design is clean and straightforward, dominated by shades of blue and white, reflecting a professional and analytical theme.
At the top left, the company’s name is positioned beside a visual icon, suggesting a place for branding. Below the company name, there’s a bold heading “Bar Chart,” clearly labeling the slide’s purpose. Under the heading is a text box with placeholder text, indicating where detailed information or analysis related to the bar chart can be added by the presenter.
The central feature of the slide is a bar chart with four categories. Each category is represented by vertical bars of varying heights, indicating different values or metrics. The bars are colored in two shades of blue and gray, facilitating a distinction between sets of data or performance metrics within each category.
On the top right corner of the slide, there is a circular infographic with an icon representing analytics or growth, and next to it, there’s a figure “7.5%” labeled as “Annual Growth,” highlighting a key statistic.
At the bottom, there’s an additional prompt to “Add your company website here,” offering a space for customization.
This slide is suitable for a variety of business applications, such as financial reporting, performance reviews, sales presentations, or any scenario where data visualization is key to the discussion. The bar chart is a standard tool for presenting quantitative information in an accessible and visually engaging way, making it useful for audiences within and outside the company.
Return to Business Profile PowerPoint Template.
Download unlimited PowerPoint templates, charts and graphics for your presentations with our annual plan.
DOWNLOADReturn to Business Profile PowerPoint Template.
