The Business Deal Infographic Diagram for PowerPoint illustrates a step-by-step guide to a successful business deal. It is useful in orienting a new business team in the most effective way to go about securing a deal for the company.
A business deal is the core of the corporate world. It signals the beginning – and unfortunately, the end – of a business relationship. These relationships and connections are the life blood of business. The conception of a business deal begins with the initial meeting. This is where one of the parties introduces a prospective business plan for the other, usually a bank or an investor.
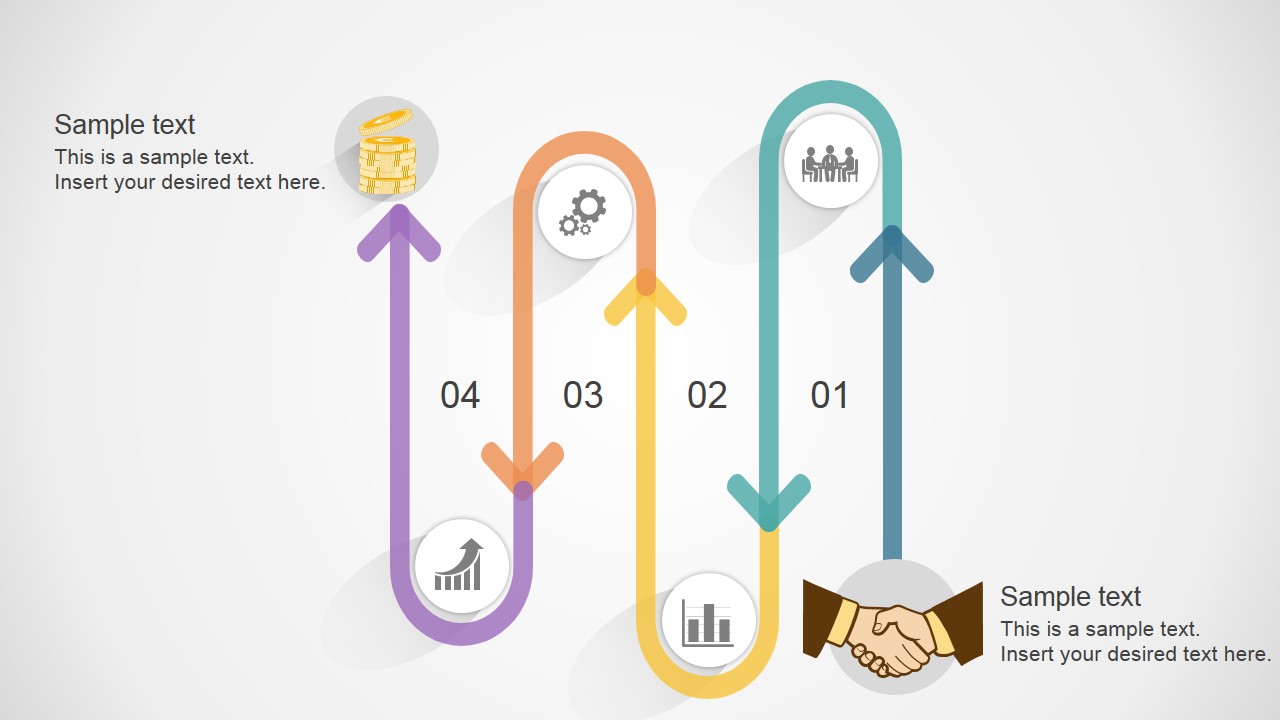
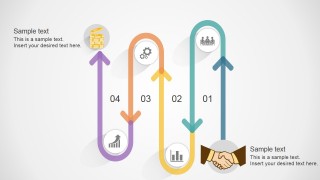
As seen on the slide, initial meeting leads to a brainstorming session featured on the first step. It involves the company representative in the deal, joining a collective discussion with other company executives to discuss the pros and cons of the deal. The step is then followed by the analysis of the other party’s historical records and data, shown on the second step. It involves analyzing past trends in the information, in order to determine whether the deal is worth it. The next step in the process is represented by gears. It shows the mechanical or the practical implementation. This can be done through market testing or through model experiments. The results from these tests are then reflected in the fourth step, which shows a rising bar graph. This step can include statistical forecasting to show the possible increase in profits or customer demands.
The end of the process is symbolized by a stack of coins. This can represent the finalization of the deal – that is, the actual transfer of funds from the customer to the company. Whether or not this stage happens is an indicator of the success of the proposal.
Use the Business Deal Infographic Diagram for PowerPoint for preparing the company’s representatives to a particular business deal. It can help them prepare themselves up for the presentation, while providing tips that can help them in the actual deal. The PowerPoint objects are fully customizable, allowing the user to adapt the slide look and feel to their own corporate branding and style. The presenter can download additional visual assets from our PowerPoint Templates Gallery to cover different proposal metaphors.
What’s inside this template
Example presentation scenarios
- A sales manager can use the four numbered arrow lanes to brief account executives on the expected path from first meeting to closed deal.
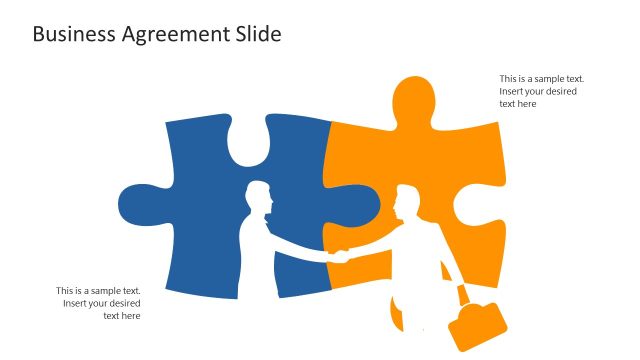
- A business development lead can use the handshake illustration and coins icon to explain how relationship building connects to revenue outcomes.
- A startup founder can use the team, chart, and gear icons to show investors how the company evaluates and tests a proposed partnership.
- A trainer can use the left and right text placeholders to add short instructions for each deal stage during a team onboarding session.
Features
- 100% editable presentation template
- Compatible with Microsoft PowerPoint and Google Slides
- 16:9 aspect ratio slides
- Scalable vector shapes, icons and illustrations
- AI-Ready for Microsoft Copilot and Claude
- Instant access and download
Frequently asked questions
Q: How should a presenter explain the process without making the slide feel crowded?
A: Treat the slide as a guided process, not a list. Start with the handshake as the opening agreement or prospect meeting, then move through the numbered lanes in order. Use the left and right text areas for short stage summaries only, and explain details verbally so the icon path remains easy to follow.
Q: Who is this diagram best suited for in a business presentation?
A: This diagram works best for sales leaders, business development teams, founders, and consultants who need to align people around a repeatable deal path. It is useful when the audience needs a quick shared mental model for how discussions, analysis, implementation, forecasted growth, and financial close connect.
Q: Why does the slide use looping arrows and business icons instead of a straight timeline?
A: The looping arrows imply that deal work is sequential but still connected across stages. The handshake, team, chart, gear, growth, and coin icons act as visual anchors, helping the audience remember the purpose of each step. This metaphor is stronger than a plain line when the topic is negotiation and business progress.
Business Deal Infographic Diagram for PowerPoint
1-slide presentation template for business deal process steps with handshake and arrow infographic
Business Deal Infographic Diagram for PowerPoint is a 1-slide process diagram for explaining a deal path from meeting to financial outcome. The slide shows a handshake illustration, four numbered arrow lanes, circular icons for team discussion, analytics, gears, growth, and coins, plus text callouts for presenters using PowerPoint or Google Slides.
- Category
- Shapes
- Rating


 Loading...
- Aspect ratio
- 16:9, 4:3
- Item ID
- 7030-01
- Colors
 Microsoft PowerPoint
  Microsoft Copilot
  Claude for PowerPoint
 Other formats supported
Subscribe today and get immediate
access to download our PowerPoint templates.