Bridge’s Transition Model PowerPoint Template
The Bridge’s Transition Model PowerPoint Template can help individuals and organizations assess and manage their work during the process of change. By definition, change is an external event in the organization or a person’s professional life, e.g., implementing a new business strategy. In contrast, the transition is a physiological effect of people’s change during change. For the effective implementation and growth of the company, it is necessary to manage & address what the workers are going through. By using this template, transition managers can discuss various phases of transition and their expected outcomes, which can further help them devise managerial action plans.
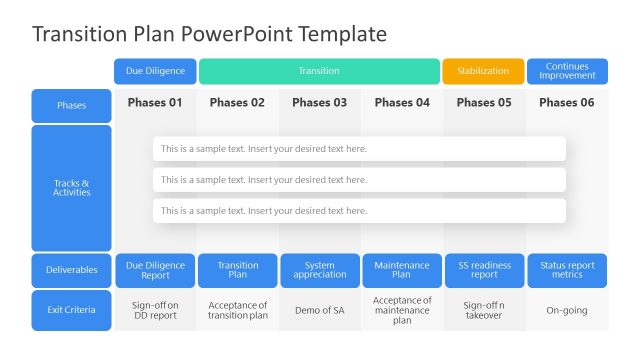
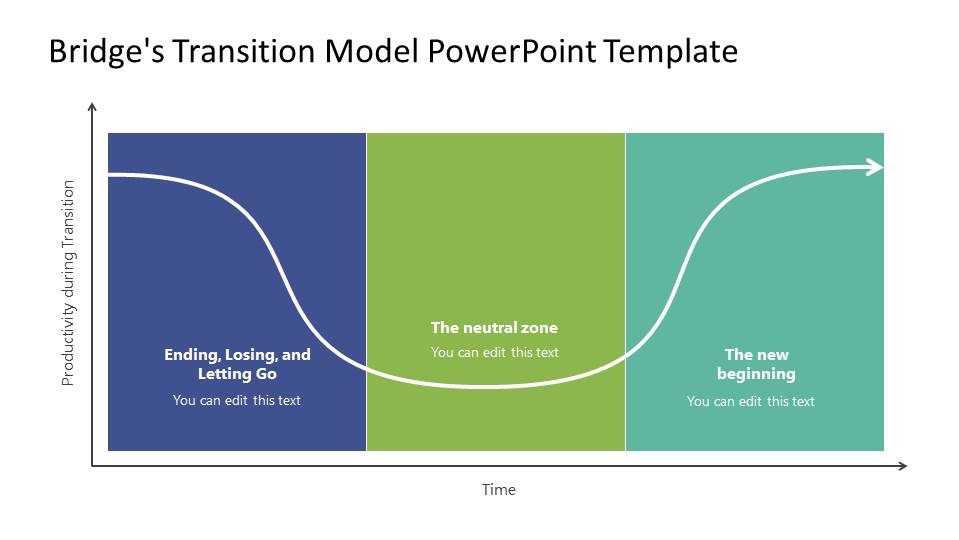
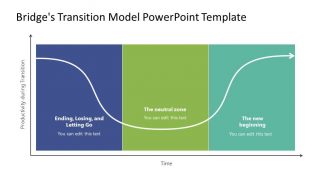
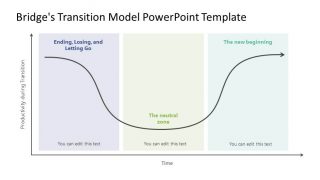
Bridge’s transition model displays three transition phases in the form of graphs. The first stage of this process is Ending or Letting Go. Right after this ending, there is a phase in which no net activity is performed, i.e., the in-between situation. This is known as the Neutral Zone. The needed physiological changes occur in this zone, continuing until the New Beginning stage. This new beginning phase represents the growth initiatives and new implementations.
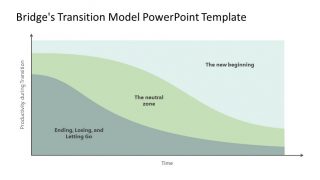
The Bridge Transition Model PowerPoint Template provides two different layouts to represent the transition process. In the first one, a line graph has Productivity and Time on the Y and X-axis, respectively. The chart is divided into three quadrants, where the first one has a descending slope representing a decrease in output. The hill continues to be parallel with the x-axis in the second quadrant, which depicts a neutral zone or no net productivity. Further, the line ascends in the third quadrant, showing an increase in the productivity of the process. This slide has two color variations; one is dark-colored while the other is light. In the second layout, an area chart represents the Ending, Neutral, and New Beginning phases in its three divisions. It also shows the productivity variation with time during the three transition stages.
The Bridge Transition Model PowerPoint Template is a simple pictorial model for management consultants and HR teams. It helps them discuss what kind of change the company is planning and how different groups or individuals will be affected. Further, this model helps them determine the transition readiness of the company. So, transition managers can effectively discuss and plan the managerial tasks using this PowerPoint template with the employees and staff.
Users can customize this template to well-plan the transitional effects of change and orient their energies in the right direction, which is only possible if the physiological changes are managed during the transition process. The template is ready to use and is 100% editable on PowerPoint and Google Slides.


You must be logged in to download this file.
DOWNLOAD- Category
- Models
- Rating

 Loading...
- Size
- 16x9
- Item ID
- 20532-01
- Colors
Subscribe today and get immediate
access to download our PowerPoint templates.