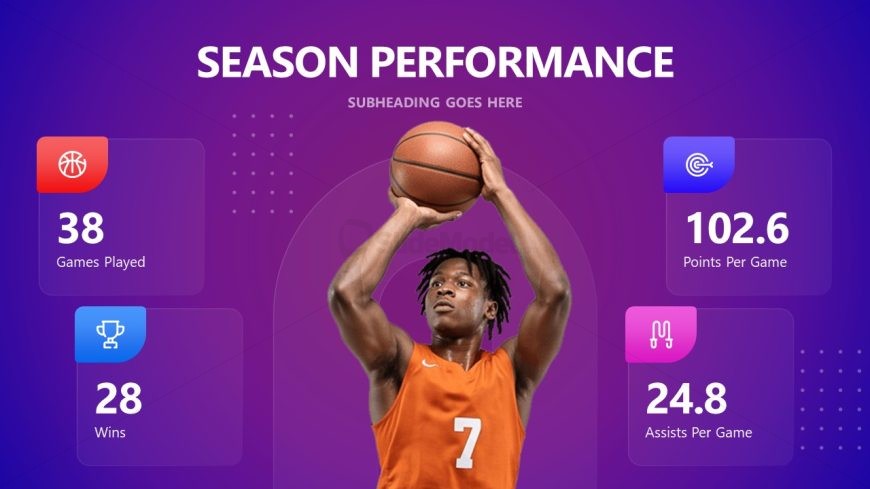
Slide 4 of 12 from Basketball Sport PowerPoint Template
Season Performance Visualization with Infographics and Player Imagery
Basketball Season Performance Metrics Slide
- Text Layout
- Other
- Evaluation Slide
- 16:9
- 100% Editable
The Season Performance Metrics slide from the Basketball Sport PowerPoint Template offers a clear layout for presenting player statistics and team evaluations. Designed for sports analysis presentations, this slide uses editable shapes and vector icons to highlight key metrics such as games played, wins, points, and assists. Its structured design supports effective communication in corporate presentations or pitch deck templates focused on athletic performance.
What’s on This Slide
The slide features a gradient purple background with a central image of a basketball player shooting. Four rectangular containers are positioned around the player. The top left contains an icon and the text '38 Games Played.' The bottom left shows '28 Wins' with a trophy icon. The top right displays '102.6 Points Per Game' alongside a target icon. The bottom right states '24.8 Assists Per Game' with a play icon. Text placeholders for the title and subheading are centered at the top. The overall layout emphasizes key performance statistics.
How to Use It
This layout serves to present key performance metrics in a sports context, ideal for summarizing a player's season statistics. It fits well after introductory slides, providing a clear overview of performance. This structure is useful for coaches, analysts, or sports managers presenting player performance data. It can also be adapted for team performance summaries or comparative analyses in sports presentations.
Text Placeholders & Capacity
Keep your copy within these limits so it fits without resizing. Node labels can hold about 20 characters each.
| Placeholder | Count | Max characters (approx.) |
|---|---|---|
| Slide title | 1 | 30 |
| Item heading | 4 | 20 |
| Item body | 4 | 25 |
Slide Keywords
Download unlimited PowerPoint templates, charts and graphics for your presentations with our annual plan.
DOWNLOADReturn to Basketball Sport PowerPoint Template.