Slide 8 of 12 from Basketball Sport PowerPoint Template
Game Analysis Slide with Data Chart for Basketball Sport Template
Basketball Game Analysis Slide
- Chart
- Bar Vertical
- Evaluation Slide
- 16:9
- 100% Editable
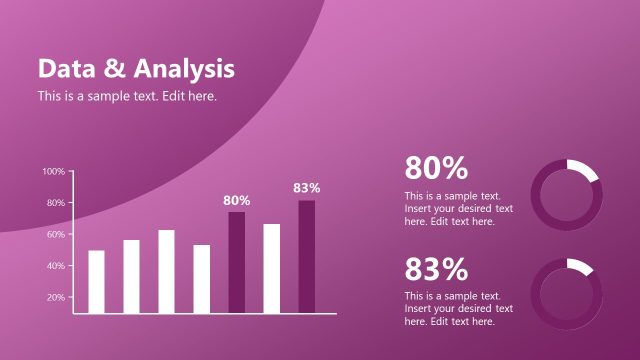
The Game Analysis Chart slide from the Basketball Sport PowerPoint Template offers a clear visual evaluation of sports performance using a vertical bar chart and key statistics. This slide layout is designed for team strategy meetings and game outcome presentations, featuring editable shapes and data visualization elements that enhance corporate presentations or pitch deck templates focused on athletic performance analysis.
What’s on This Slide
The slide features a bar chart positioned on the left side, displaying four bars representing data across four quarters (Q1 to Q4). The bars are color-graded from yellow to red, indicating varying values, with a maximum scale of 30. To the right, there are two text boxes: one highlights a 48% field goal statistic and the other shows a 41% for 3-point shots. Each text box contains placeholder text for additional information. The background is a gradient of purple, enhancing the visual impact of the chart and text elements.
How to Use It
This layout serves to present quantitative game analysis, ideal for sports performance reviews. It fits well in a sequence following performance metrics or player statistics, providing a visual summary of game outcomes. This slide is useful for coaches, analysts, or team managers to communicate key performance indicators effectively. It can be used in meetings or presentations focused on game strategy and improvement areas.
Text Placeholders & Capacity
Keep your copy within these limits so it fits without resizing. Body slots can accommodate roughly 20-30 words each.
| Placeholder | Count | Max characters (approx.) |
|---|---|---|
| Slide title | 1 | 30 |
| Subtitle | 1 | 50 |
| Item heading | 4 | 5 |
| Item body | 2 | 50 |
| Body paragraph | 1 | 150 |
Slide Keywords
Download unlimited PowerPoint templates, charts and graphics for your presentations with our annual plan.
DOWNLOADReturn to Basketball Sport PowerPoint Template.