Slide 15 of 17 from Ballot PowerPoint Template
6201-01-ballot-box-15
Ballot Map for Voting Presentation
- Map
- Country Map
- Context Slide
- 16:9
- 100% Editable
The Ballot Map slide from the Ballot PowerPoint Template offers a clear geographic visualization of voting data and ballot distribution using editable shapes and vector icons. This slide layout supports business presentations and pitch deck templates focused on election trends by combining a dark-themed map with connected data points for enhanced clarity.
What’s on This Slide
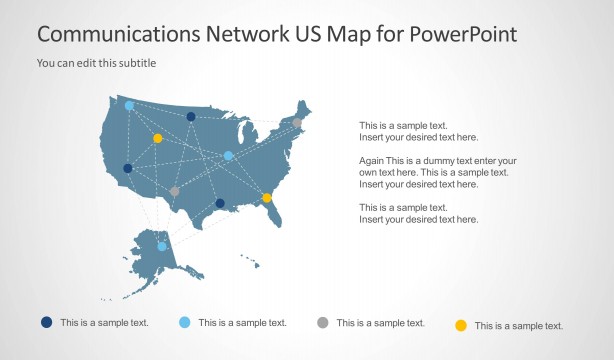
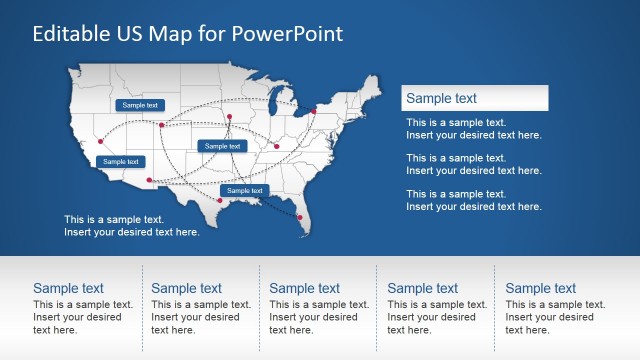
The slide features a map of the United States, positioned centrally. It is overlaid with a network of lines connecting various colored nodes, representing different data points. The background is dark, enhancing contrast with the map. At the top, there is a title placeholder aligned left, while a large text placeholder is positioned on the right side for additional information. Below this, smaller text placeholders are arranged vertically, allowing for detailed descriptions. The overall layout emphasizes the map and its connections, creating a clear visual hierarchy.
How to Use It
This layout serves as a geographic representation of voting data or ballot information. It fits well in presentations discussing election processes, voting systems, or civic engagement. The map can illustrate regional voting trends or ballot distribution. It is effective for visualizing complex data in a straightforward manner, making it suitable for both formal and educational contexts. This slide can be used after problem identification slides to present solutions or data-driven insights.
Text Placeholders & Capacity
Keep your copy within these limits so it fits without resizing. Body slots can accommodate roughly 8-10 words each.
| Placeholder | Count | Max characters (approx.) |
|---|---|---|
| Slide title | 1 | 30 |
| Body paragraph | 5 | 50 |
Slide Keywords
Download unlimited PowerPoint templates, charts and graphics for your presentations with our annual plan.
DOWNLOADReturn to Ballot PowerPoint Template.