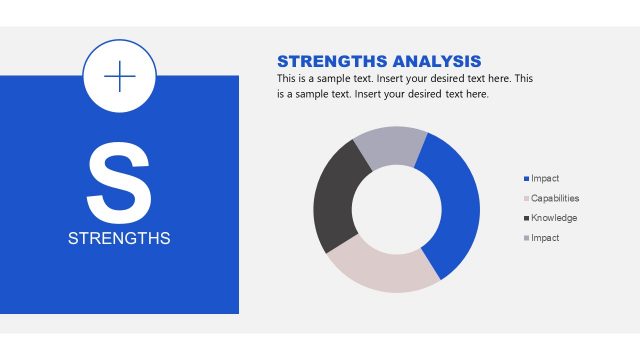
Slide 4 of 8 from Animated SWOT Analysis Template
3D SWOT Percentage Design For PowerPoint
Strength Analysis Bar Chart for SWOT Presentation
- Chart
- Bar Horizontal
- Strategic Analysis Slide
- 16:9
- 100% Editable
What’s on This Slide
The layout features a horizontal bar chart with four colored segments representing percentages. The leftmost segment is yellow, labeled '30%', followed by an orange segment at '55%', a red segment at '45%', and a purple segment at '70%'. Above the bar chart, there is a prominent title 'STRENGTH' in large font, accompanied by a circular icon depicting a flexed arm. Below the title, there are two text placeholders for descriptions, aligned center. The background is light gray, providing contrast to the colorful elements.
How to Use It
This layout serves as a visual representation of strengths in a SWOT analysis, fitting into a presentation after problem identification. It is suitable for business contexts where strengths need to be highlighted, such as strategic planning or performance reviews. This slide can be used to compare multiple strengths quantitatively, making it effective for stakeholder presentations or team discussions.
Text Placeholders & Capacity
Keep your copy within these limits so it fits without resizing. Node labels can hold brief text, roughly 5 characters each.
| Placeholder | Count | Max characters (approx.) |
|---|---|---|
| Slide title | 1 | 30 |
| Item heading | 4 | 5 |
| Item body | 4 | 50 |
Slide Keywords
Download unlimited PowerPoint templates, charts and graphics for your presentations with our annual plan.
DOWNLOADReturn to Animated SWOT Analysis Template.