Gap Analysis Performance Measure Tool
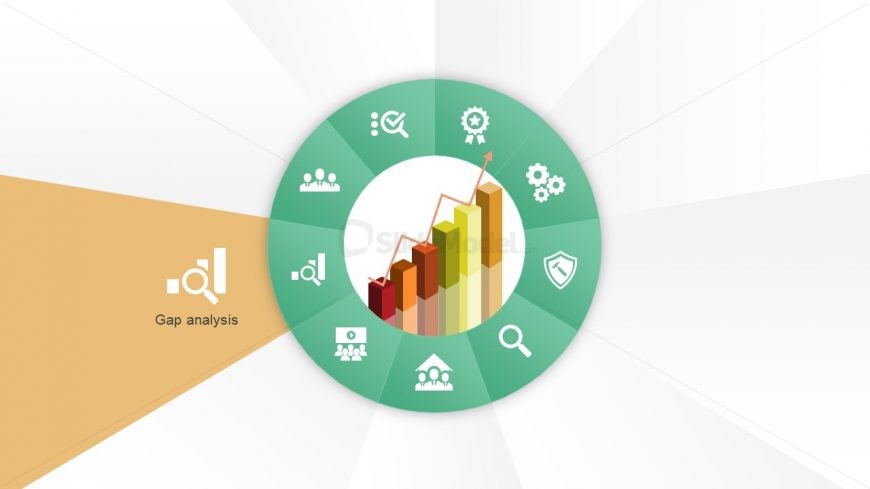
The Gap Analysis Performance Measure Tool slide is another phase of quality management system. This section is helpful in explaining the comparison of actual and desire performance. The gap analysis helps organization to make best of their available resources and invest in technology accordingly. The circular template diagram if fully customizable with the creative clipart icon to demonstrate gap analysis concept. The editable PowerPoint template enables users to alter various aspects of circular diagram. The quality management system phases are also presentable individually. However, this stage assess the performance of business information system and applied application.
Return to 9 Steps Circular Diagram With Service Icons.
Download unlimited PowerPoint templates, charts and graphics for your presentations with our annual plan.
DOWNLOADReturn to 9 Steps Circular Diagram With Service Icons.
