7 Step Circular Diagram for Optimization Process PowerPoint Template
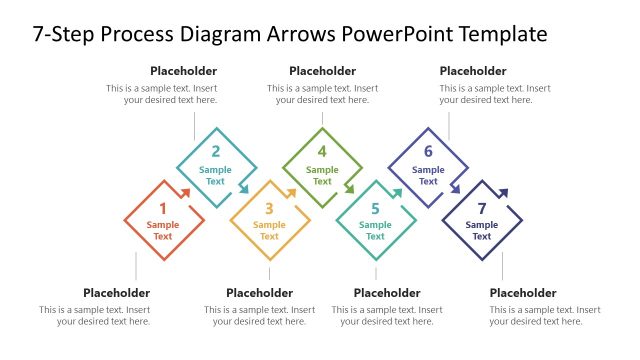
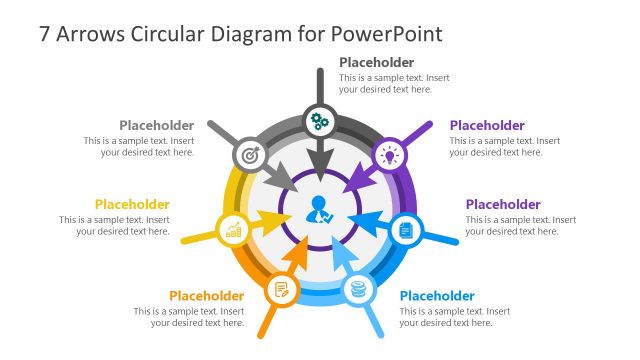
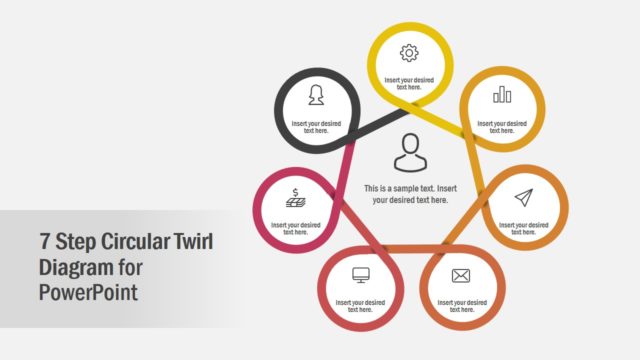
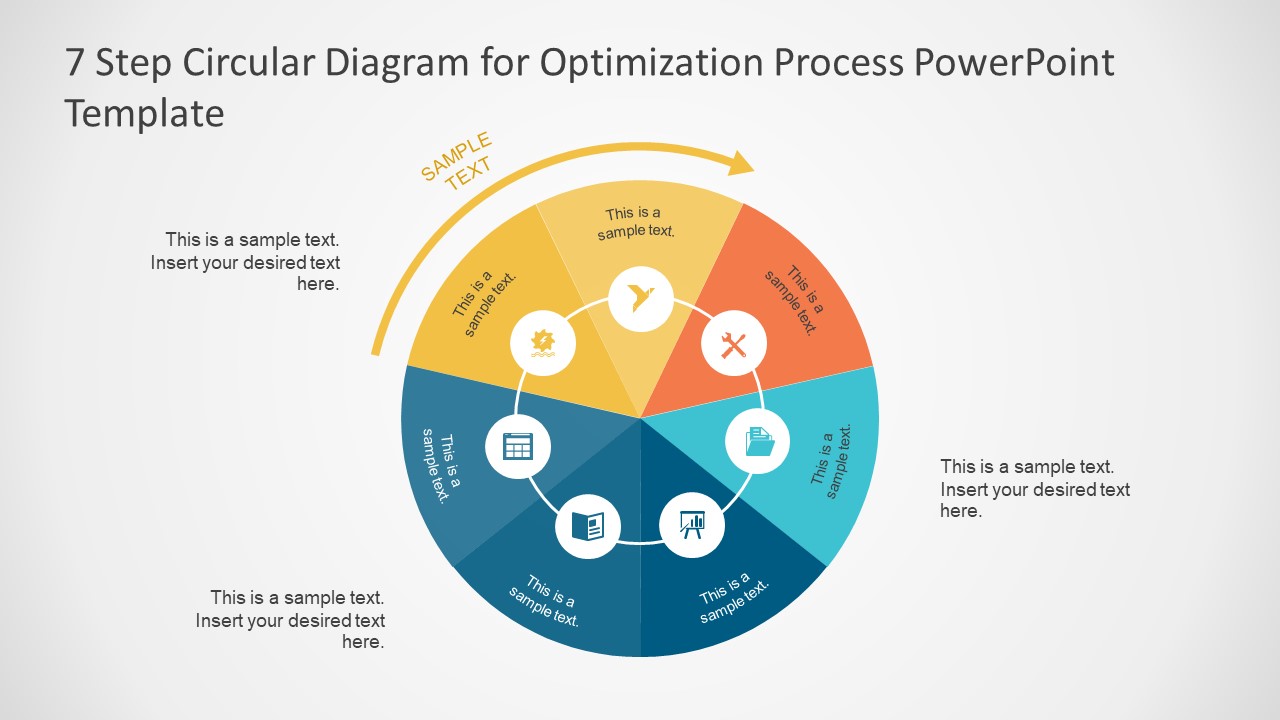
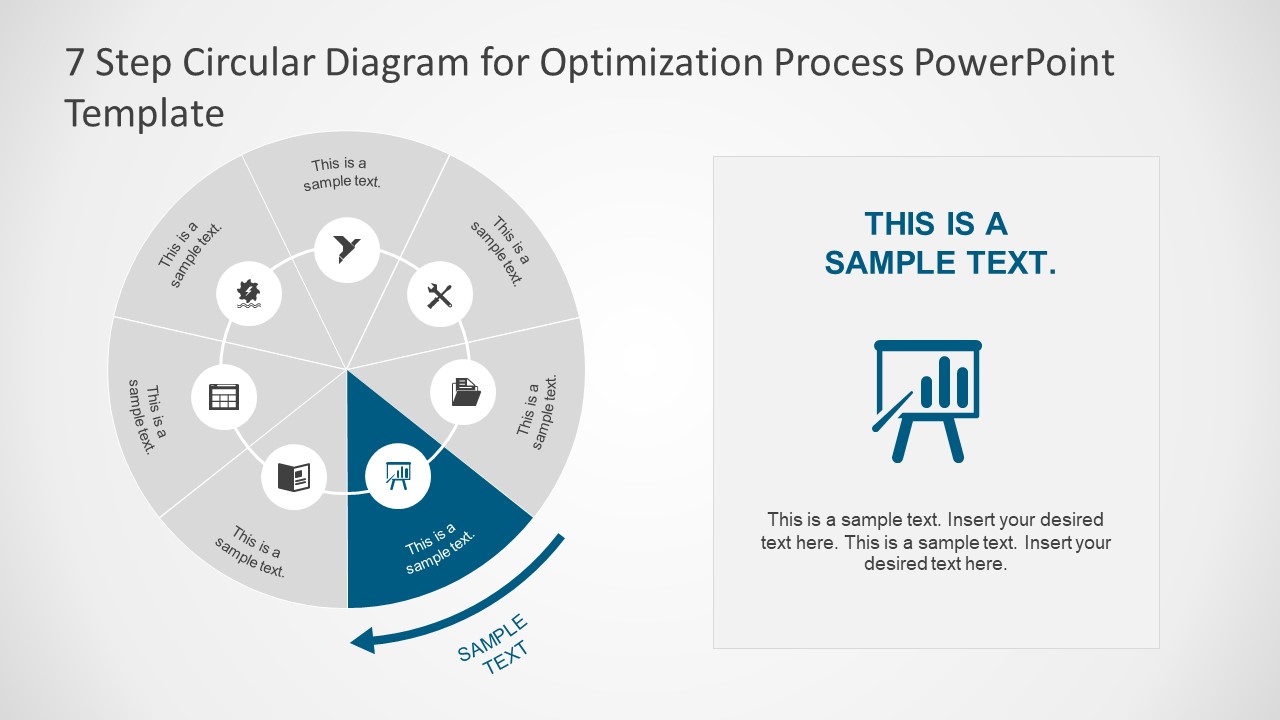
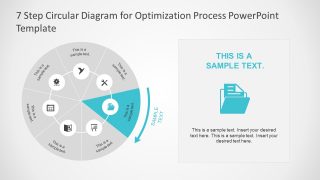
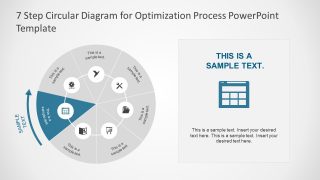
The 7 Step Circular Diagram for Optimization Process PowerPoint Template is a business management presentation. Here, the PowerPoint of seven circular segments is a process flow diagram for monitoring and optimization of project. This PowerPoint diagram illustrate how interconnecting different variables can create an entire system. Also, it is an infographic template of Flat vector icons and shapes. The optimization as business management tool is a continual improvement process for an organization. Although, the 7 steps circular diagram, assists the professionals to visualize the process. This way, the presentation enables audience to quickly understand the concept through the interactive graphical content. This circular diagram however, helps presenters to demonstrate a system in structural manner. The five main steps of project management include, initiation, planning, execution, monitoring and control, closure. Whereas, the optimization is a part of monitoring and control process.
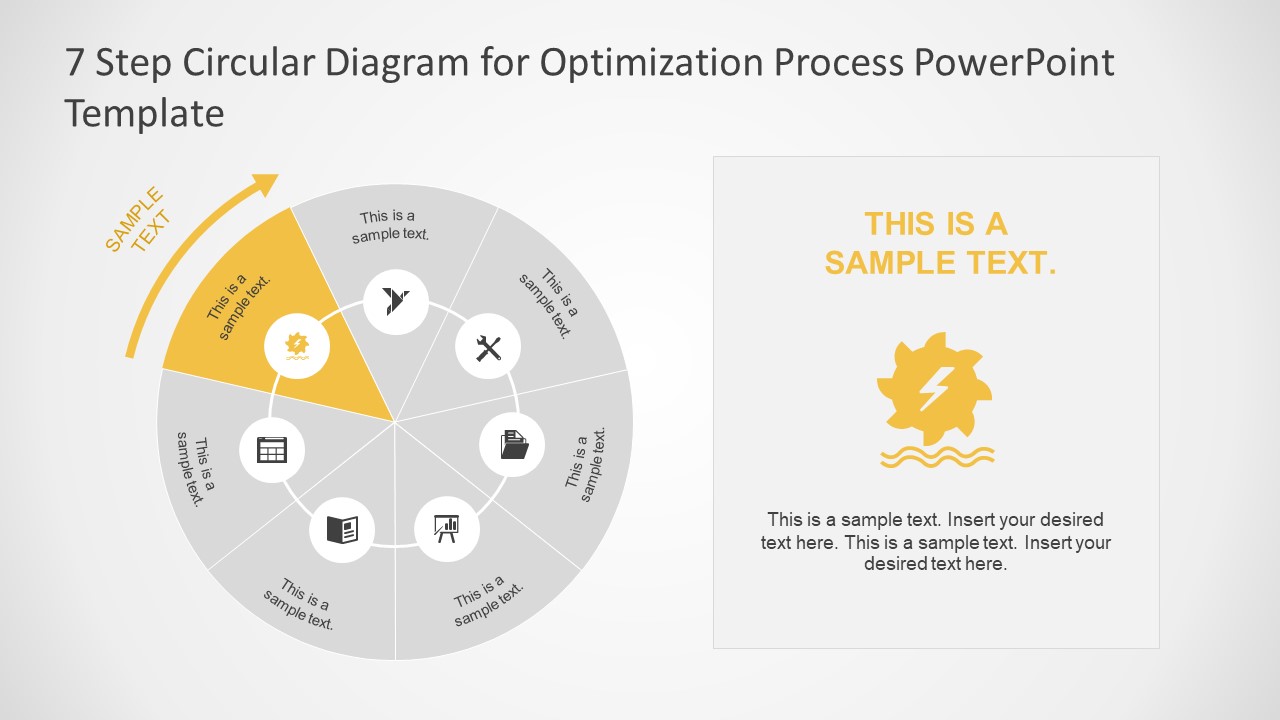
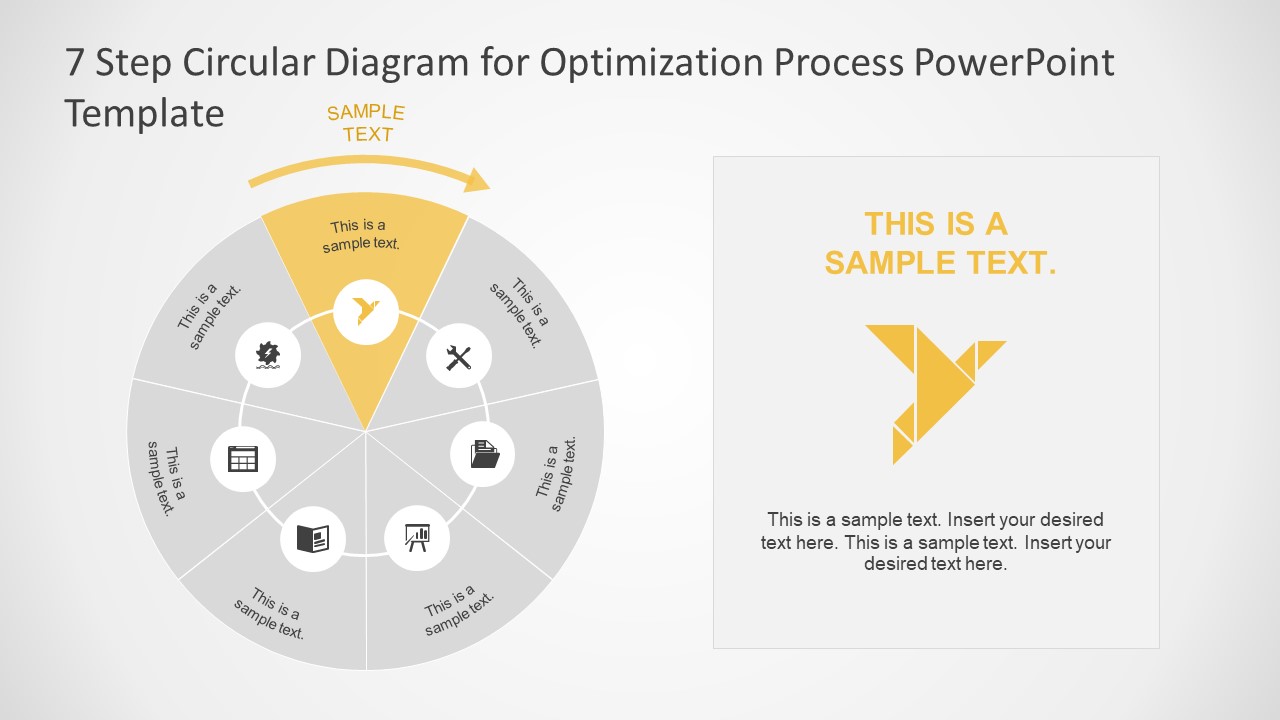
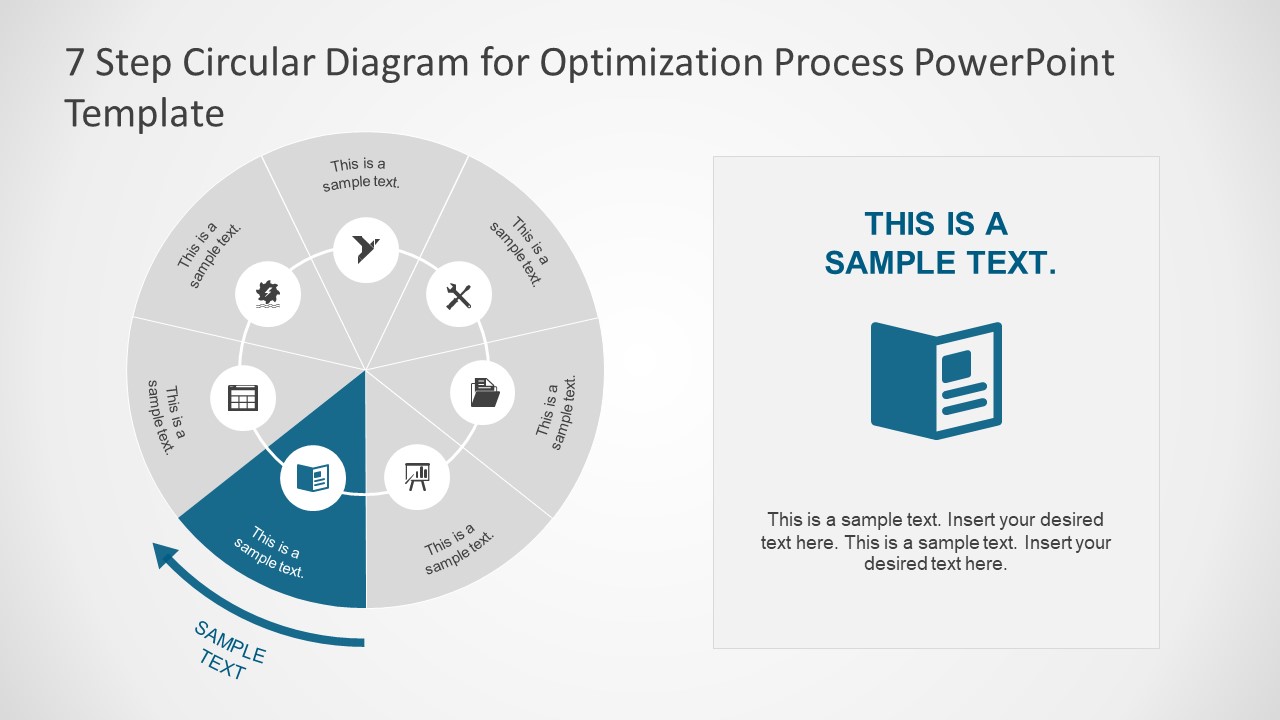
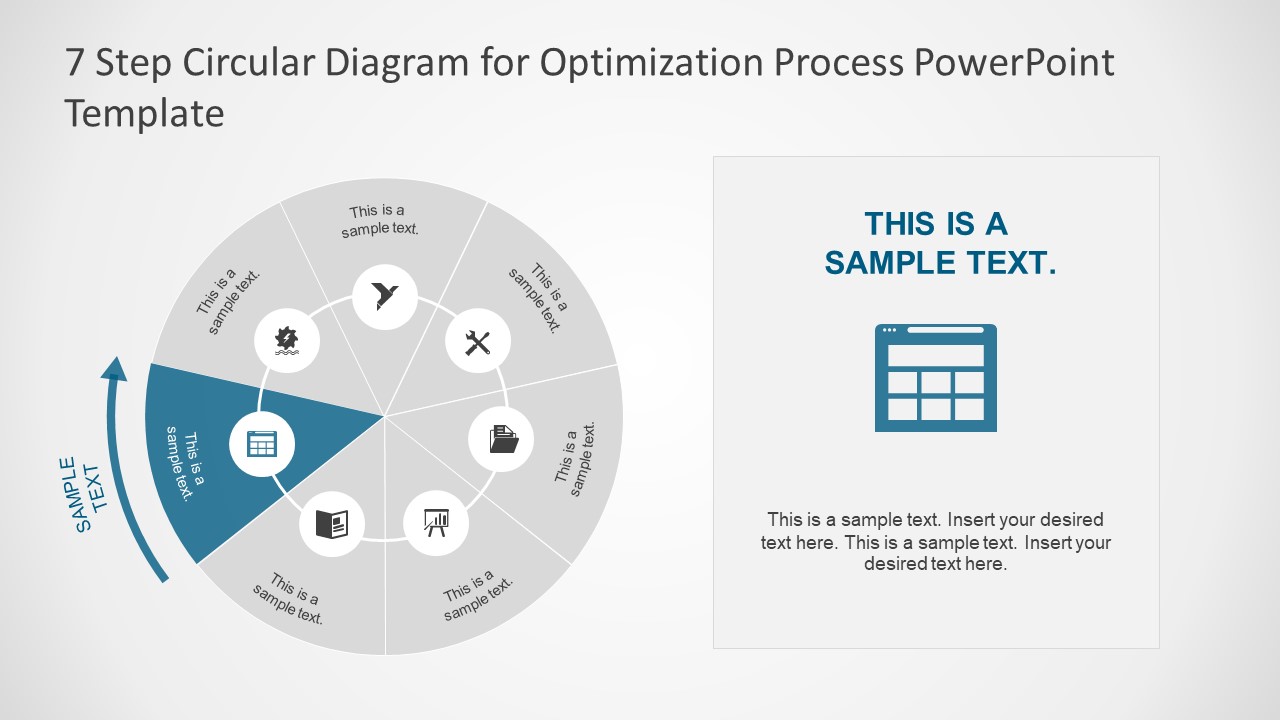
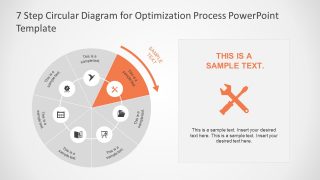
The 7 Step Circular Diagram for Optimization Process PowerPoint Template has 8 slides of amazing infographics. The circular diagram template of PowerPoint has the arrow clip art to display the direction of process flow. Further, the optimization process PowerPoint template is a colorful 7 steps set of pie shape segments. These segments include brilliant icons to represent each step of organization’s optimization process. Such as, gear icon with lightening bolt is a symbol of power. More infographics include, an origami bird, tools, report folder, slideshow, reports and spreadsheet.
The circular diagram template of PowerPoint is a 7 step fully customizable presentation for optimization process. It is a resourceful tool for business and management professionals who are responsible for modeling optimization processes of organization. Moreover, the template has one main header and 7 subsequent slides of two contents layout. These templates of optimization process diagram highlight one pie shape segment per slide with text placeholders. It is an ideal concept to successfully convey the message to the audience.


You must be logged in to download this file.
DOWNLOAD- Category
- Diagrams
- Rating


 Loading...
- Size
- 16x9
- Item ID
- 7725-01
- Colors
Subscribe today and get immediate
access to download our PowerPoint templates.