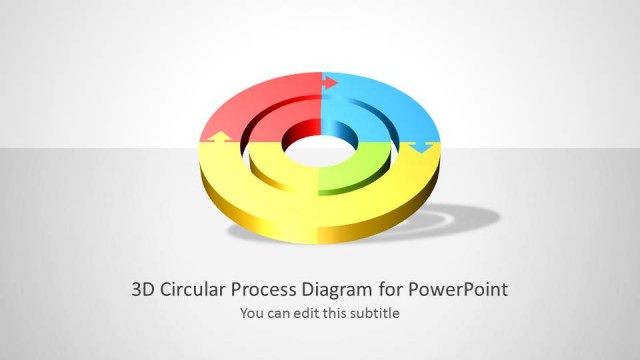
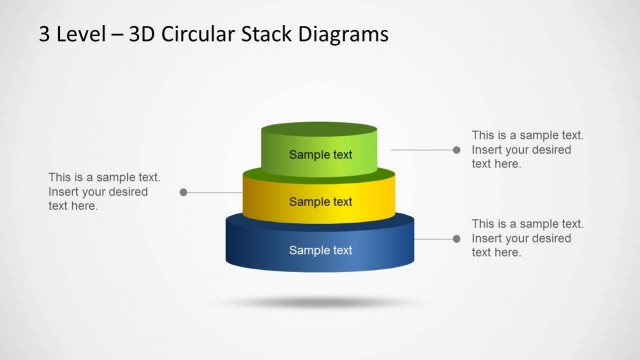
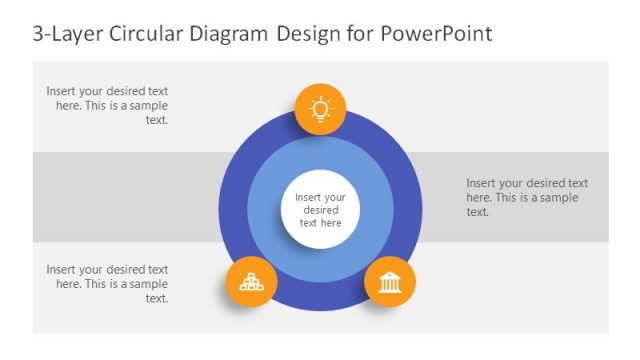
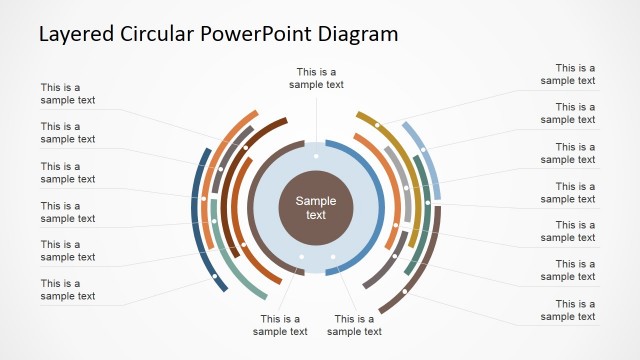
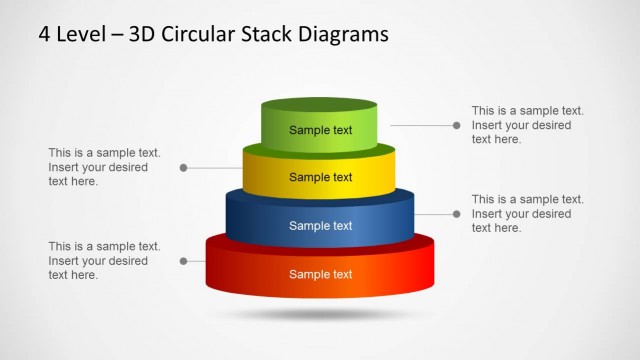
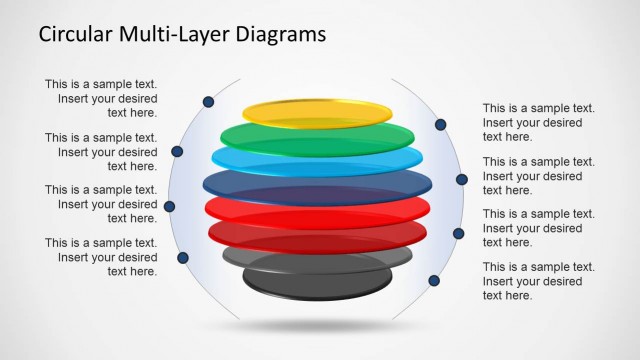
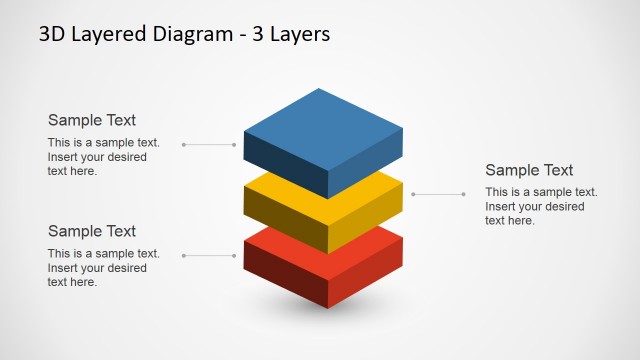
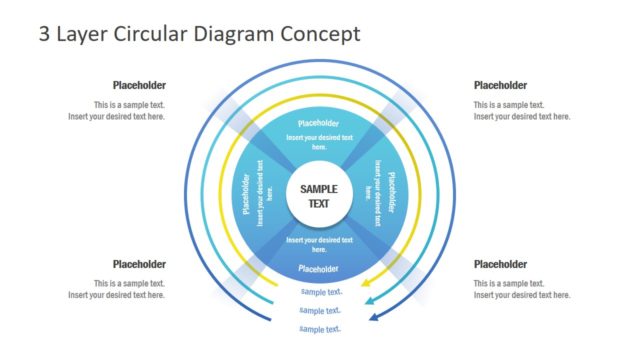
3D Multi Level Circular Diagram – Create professional presentations involving different layers with this easy to edit four Levels 3D Circular Diagram.
The diagram is created with PowerPoint Shapes involving 3D Effects, Shadows, Perspective and Gradients. The Ready to use PowerPoint Template combines traditional design best practices with professional visual effects provided by PowerPoint. Ideal for presenters that want to create a visual impact without the need of designs skills.
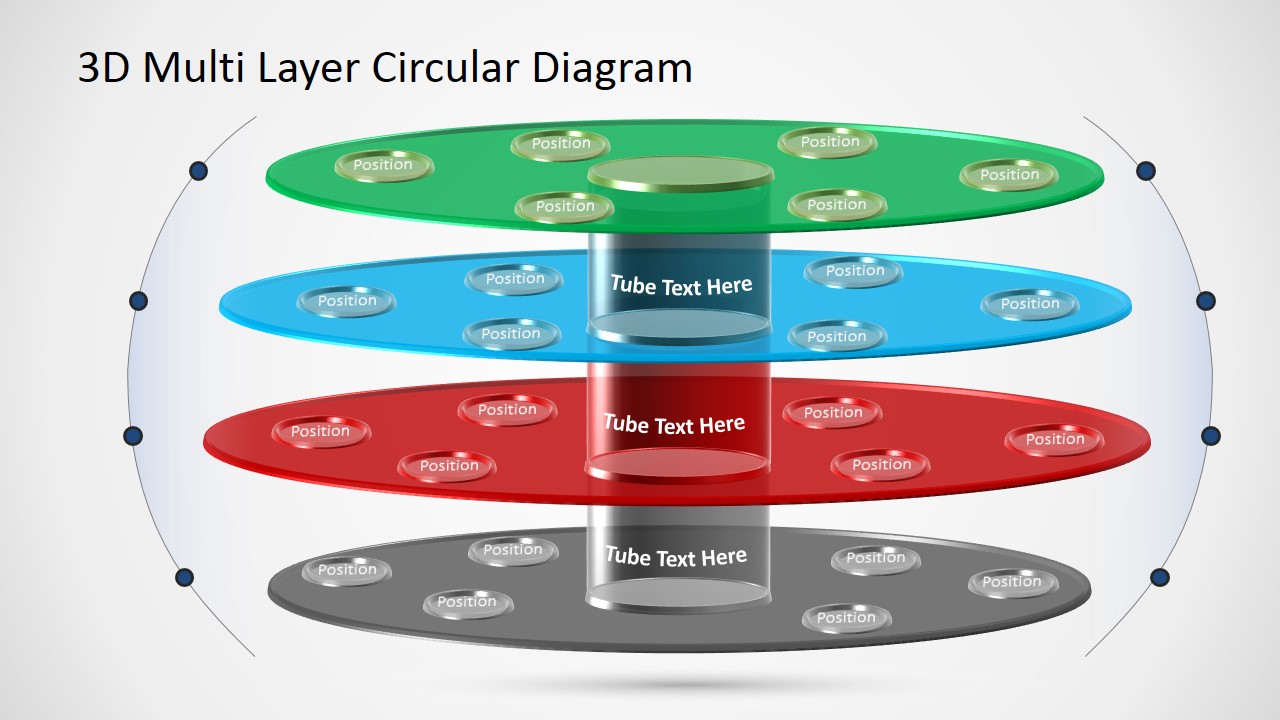
Each layer is created as a PowerPoint cylinder, with a 3D depth effect, and transparent effects across layer. Inside every circular layer, a set of circular nodes are displayed. Each node can be dragged and dropped in the desired position. Shapes can be individually customized, giving the user the flexibility required to create complex structures.
Creating PPT Templates with 3D effects require professional design skills. With the 3D Multi Level Circular Diagram the user can create presentations with professional Look and Feel without the need of investing time in the visual effect.
The diagram can be applied in different use cases. For example, it is ideal for creating Organizational charts that require a layered view of departments; the user can describe a circular organizational chart in every layer, and connect dependencies across layers through 3D cylinder connectors. It can be applied to multi dimensional diagrams that require a 3D representation, as mathematical diagram, chemistry models or life science models.
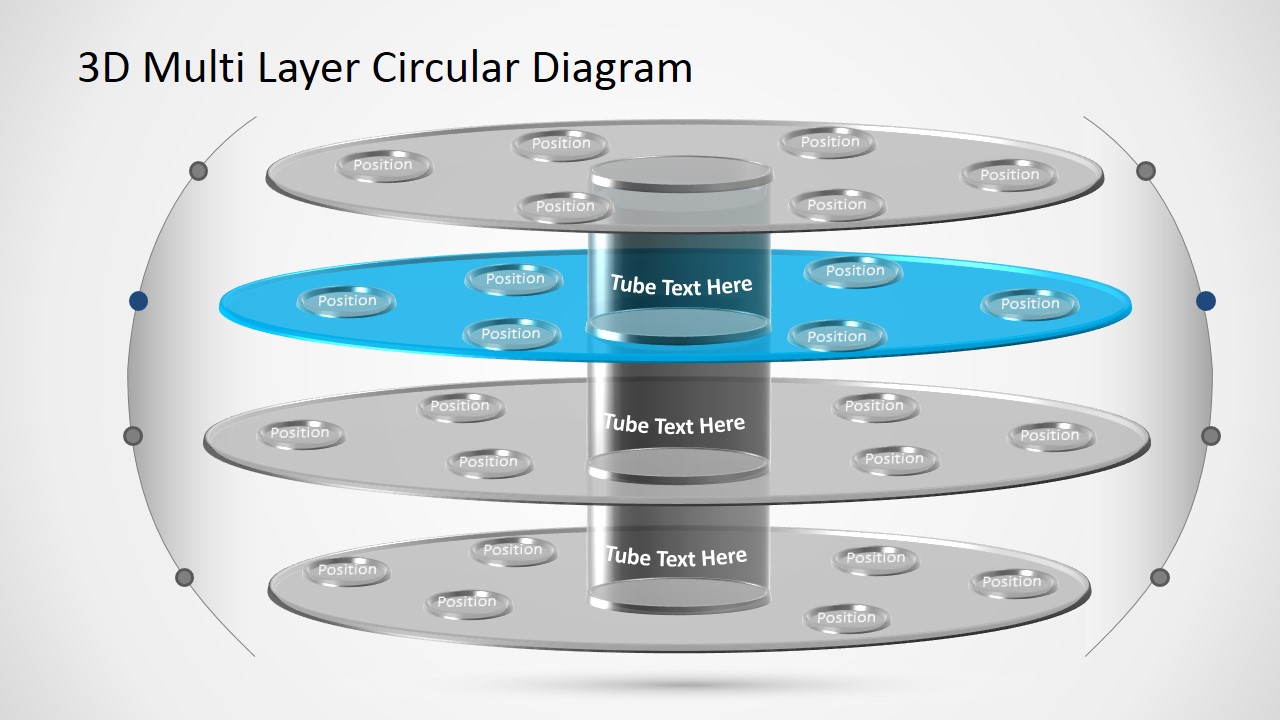
The 3D Layered Diagram is created with four layers, where each slide highlight one layer and greys the rest. With this PowerPoint Template layout, the user can create presentations that focus one slide for each layer description.
What’s inside this template
Example presentation scenarios
- A strategy consultant can use the stacked circular diagram to explain organizational layers, showing each department or governance level with position nodes and tube labels.
- A systems architect can present a technical model by assigning components to the four circular levels and using the highlighted layer slides to explain dependencies one level at a time.
- A life sciences presenter can map a layered biological or chemistry model using the circular rings for levels and the small node labels for individual elements.
- An operations manager can explain a multi-tier process or responsibility model by moving the position nodes around each layer and labeling the central tube connectors.
Features
- 100% editable presentation template
- Compatible with Microsoft PowerPoint and Google Slides
- 16:9 aspect ratio slides
- Scalable vector shapes, icons and illustrations
- AI-Ready for Microsoft Copilot and Claude
- Instant access and download
Frequently asked questions
Q: How should I explain the layered message without making the 3D diagram feel busy?
A: Start with the full four-level view to orient the audience, then move through the highlighted layer slides in sequence. Keep each position node to a short label and use the central tube text to name the relationship or connector for that level. This turns the 3D model into a guided explanation rather than a decorative object.
Q: What presentation situations fit this circular layered structure best?
A: This template fits messages where levels matter: organizational tiers, system layers, product architecture, scientific models, or dependency maps. It is strongest for presenters who need to show how items sit on separate levels while still belonging to one connected structure. It is less suited to linear schedules or numeric performance reporting.
Q: Why use a 3D stacked circular metaphor instead of a flat diagram?
A: The stacked circular metaphor helps the audience see hierarchy and containment at the same time. Each ring reads as a level, while the central tube suggests connection across those levels. The gray-out technique on slides 2 through 5 reduces visual load, letting the presenter isolate one level without losing the overall model.



3D Multi Level Circular Diagram
5-slide presentation template with 3D circular layers, tube connectors, and highlighted level views
3D Multi Level Circular Diagram is a 5-slide diagram template for Microsoft PowerPoint and Google Slides. It shows a stacked circular layer model with central tube connectors, editable position nodes, and separate highlighted level views. It fits presenters explaining hierarchy, systems, organizational layers, or multi-level relationships in 16:9 format.
- Category
- Diagrams
- Rating


 Loading...
- Aspect ratio
- 16:9
- Item ID
- 0011-05
- Colors
 Microsoft PowerPoint
 Microsoft Copilot
 Claude for PowerPoint
Other formats supported
Subscribe today and get immediate
access to download our PowerPoint templates.