3-Item Cycle Infographic Diagram PowerPoint Template
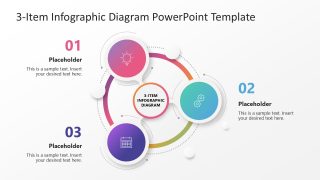
Download our 3-Item Cycle Infographic Diagram PowerPoint Template to present the three steps of a business process comprehensively. Cyclic diagrams help users communicate the relationship between multiple steps in a process. For instance, product improvement plan cycles include three steps: planning, execution, and testing. Product managers can follow these three continuous steps and repeat them until the required product is designed. Our template is also helpful for showing the steps of the learning and development cycle during academic sessions. Science teachers can use our 3-item cycle diagram to illustrate unique concepts clearly. This template is also helpful for project managers, HR managers, students, researchers, etc. Our best PPT template lets professionals explain business processes or workflow optimization cycles in simple steps during their key meetups.
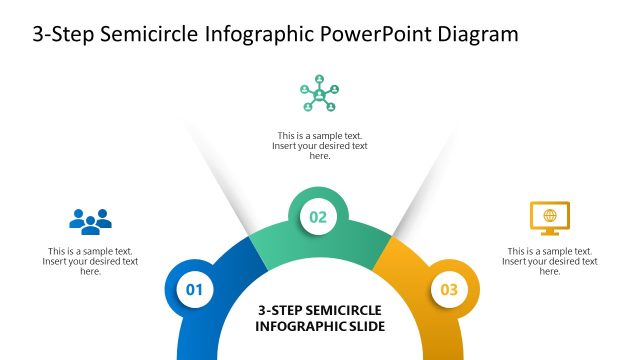
The 3-Item Cycle Infographic Diagram PowerPoint Template features editable PowerPoint elements. Also, our template is compatible with Google Slides and other versions of Microsoft PowerPoint. The template has two slides with the same diagram. The first slide has a white background, while the second one has a dark background. The diagram contains a circular shape with three circular shapes connected to a central, similar shape. In the center, display the title text, and in the outer shapes, include infographics to illustrate the point visually. Around the shapes, there are curved lines indicating the process flow.
Furthermore, with each shape, we have provided editable placeholder text and a numerical digit. The digit represents the step number, while you can edit the placeholder text to visualize the title and description of the point concisely. Download the 3-item cycle infographic diagram template for your business meetings!


You must be logged in to download this file.
DOWNLOAD- Category
- Diagrams
- Rating

 Loading...
- Size
- 16x9
- Item ID
- 23238-01
- Colors
Subscribe today and get immediate
access to download our PowerPoint templates.