1 Input & 3 Outputs Diagram Concept for PowerPoint
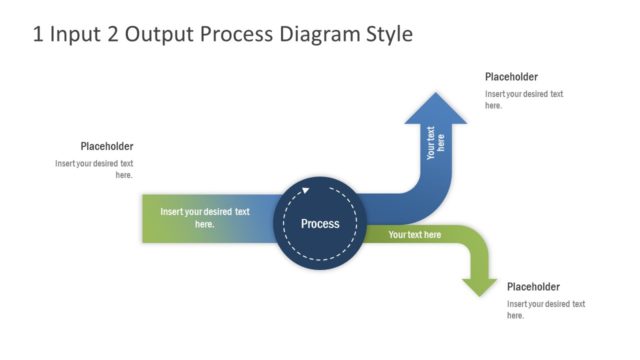
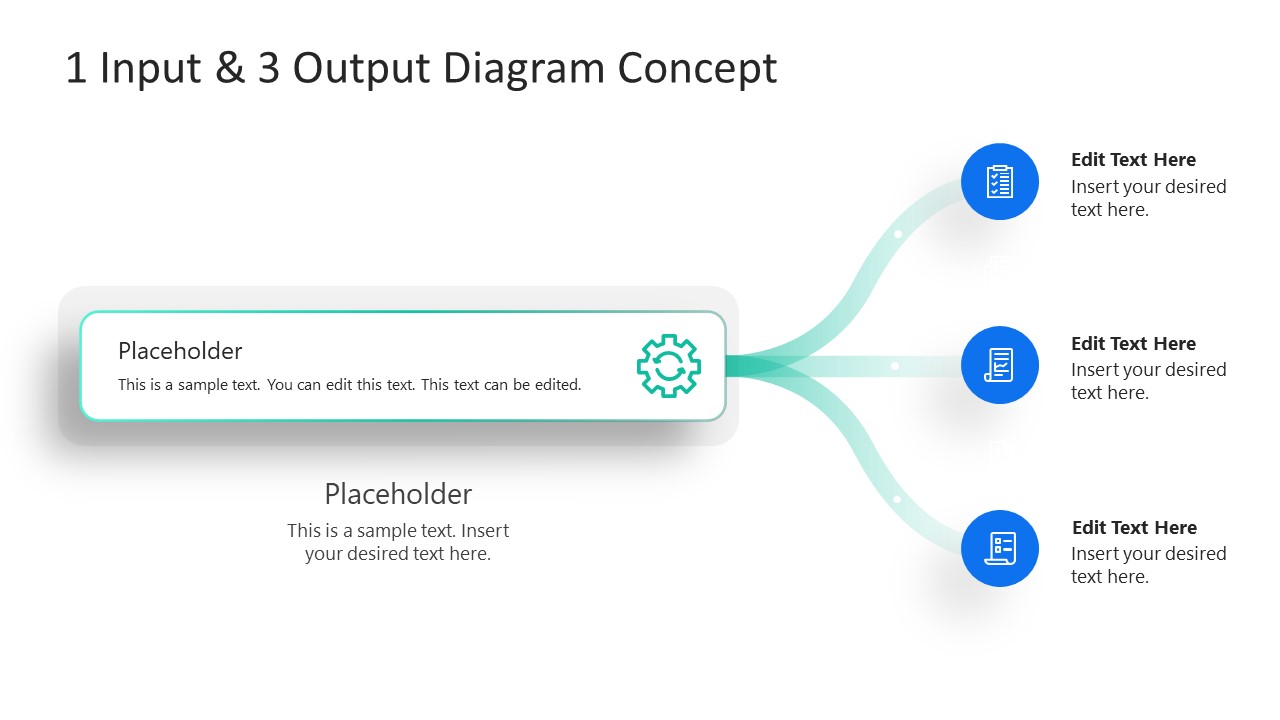
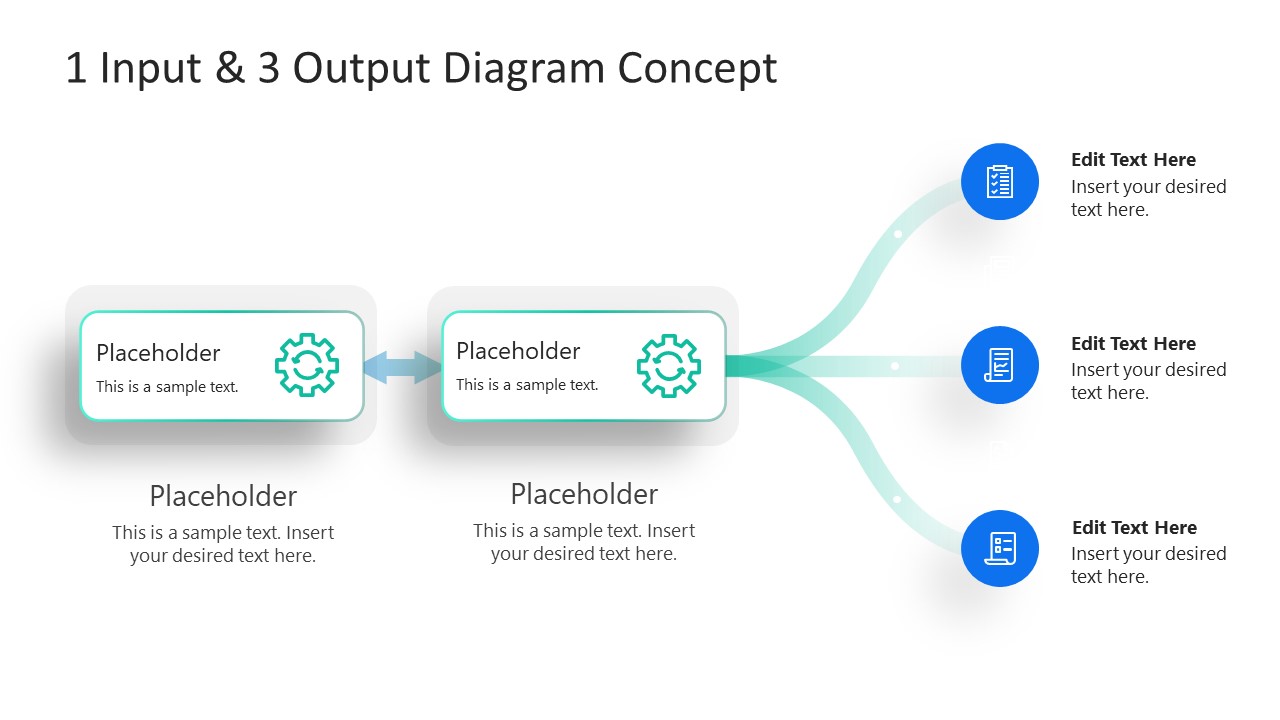
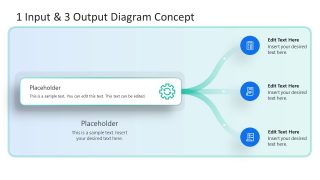
The 1 Input & 3 Outputs Diagram Concept for PowerPoint is a modern process diagram. It is based on the IPO (Input-Process-Output) model and shows one input segment and three outputs. This diagram can be used to present system analysis, workflow, business outcomes, and wherever an input-output relation is to be discussed. In software technology, professionals can use it to display the data processing and functional steps involved in the transformation from input to output.
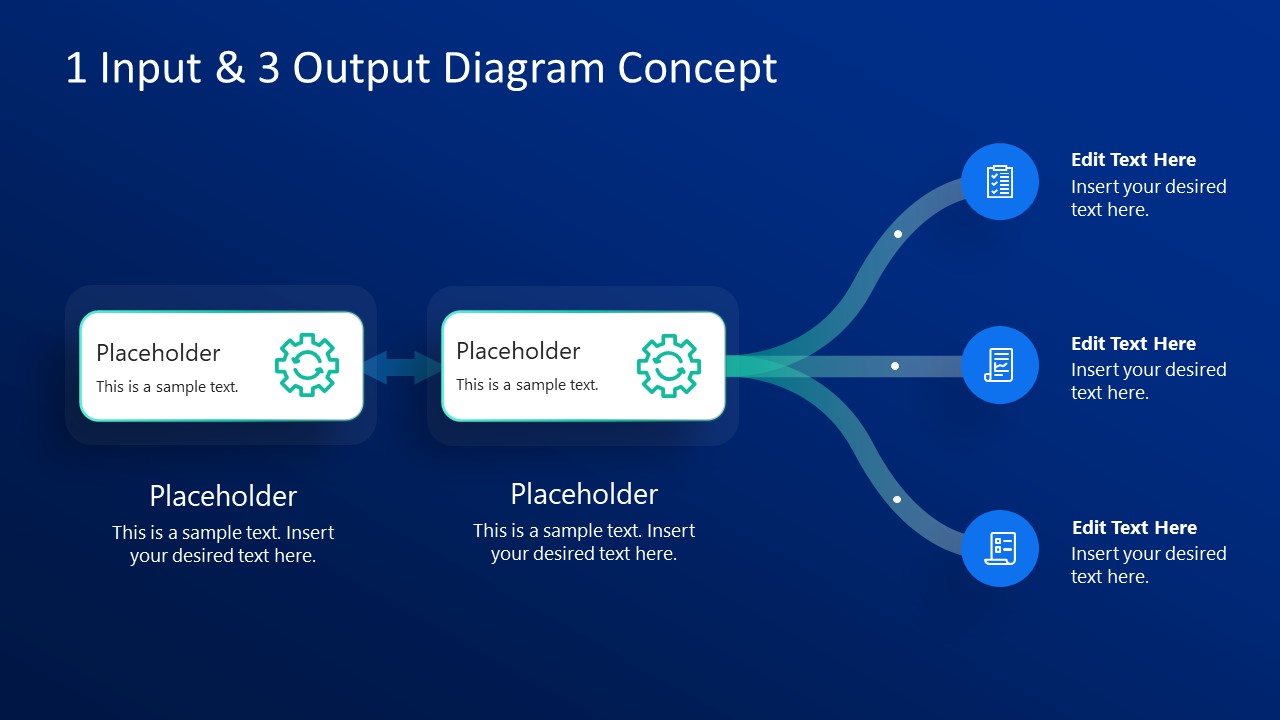
The diagram has attractive graphics, and its components give a 3D look due to the shadow effects. The shaded effect of colors further adds value to this slide design. The template provides two editable layouts available in different background color variants. The first one shows a rectangular text box that represents the 1 input. This text box carries a placeholder title and gear graphic icon. So, presenters can simultaneously discuss the role of input and processing steps using this PowerPoint shape. A shaded line emerging from this shape divides into three fragments, leading towards a specific icon enclosed in circular shapes. These icons represent the outputs and carry a text area for mentioning the titles and descriptions.
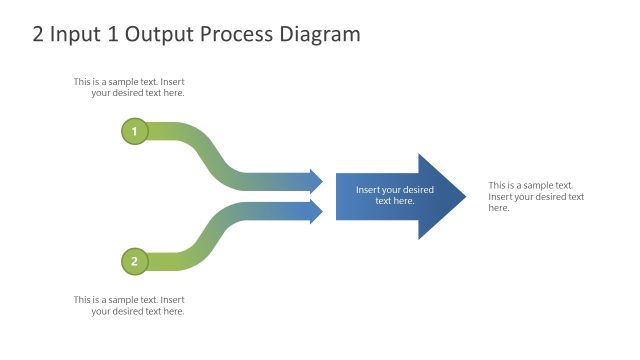
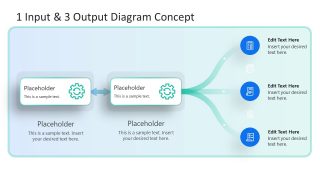
The second layout of the 1 Input & 3 Outputs Diagram Concept for PowerPoint has the same formation as the first one. However, it differs due to the presence of two in-line rectangular text boxes on the input side. This slide is mainly designed to show multiple-processing steps of the input. These two layouts are available in three color variations, i.e., white, sky-blue, and dark blue. Presenters can choose between the three and customize the slides according to their needs by changing the text and icons.
This PowerPoint template can be used by professionals to show the relationship between the input and output. It can be employed in technical, business, and marketing presentations to represent various topics. For instance, in business presentations, users can show how a particular investment led to achieving specific goals. Similarly, marketers can show the outcomes of their strategies using this interactive template. Users can also use our other Input Process diagram for PowerPoint for showing multiple inputs and outputs. All our PPT Templates are 100% editable and available with a single click. So, grab our premium templates and get maximum benefits from your presentations.


You must be logged in to download this file.
DOWNLOAD- Category
- Diagrams
- Rating

 Loading...
- Size
- 16x9
- Item ID
- 9084-01
- Colors
Subscribe today and get immediate
access to download our PowerPoint templates.