Python
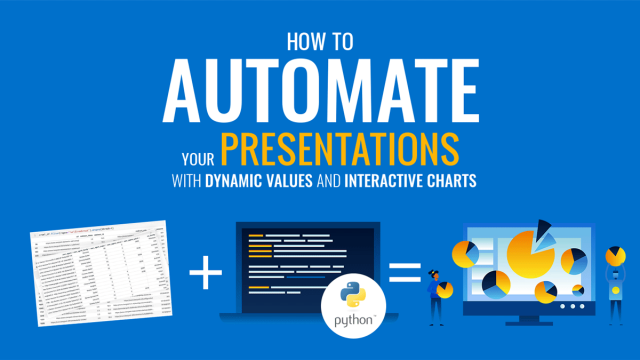
How to Automate your Presentations with Dynamic Values and Interactive Charts
One of the most important reasons we create presentations is to analyze data, get some insights, and share those findings. In some cases, when we analyze the same data numerous times, it helps a lot to automate the process.