Data

How to Present Facts: Strategies for Success
Boost the performance of your congress or seminar by mastering the art of how to present facts. Strategies, insights, and more here.
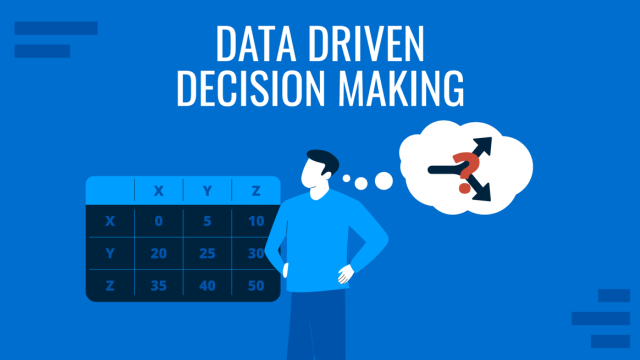
Data-Driven Decision Making: Presenting the Process Behind Informed Choices
Discover how to harness data for informed decision-making and create impactful presentations. A detailed guide + templates on DDDM presentation slides.
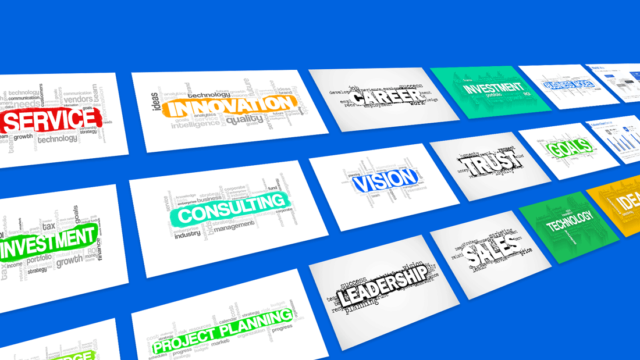
Using Word Clouds in Presentations (to Increase Audience Engagement)
Did you know that our eyes are the most powerful medium for processing information? We need far less time to extract meaning from an image, than from a piece of text. Arguably, that’s the main reason why everyone loves a good PowerPoint presentation. It breaks down the key information in an easy-to-digest manner and complements […]
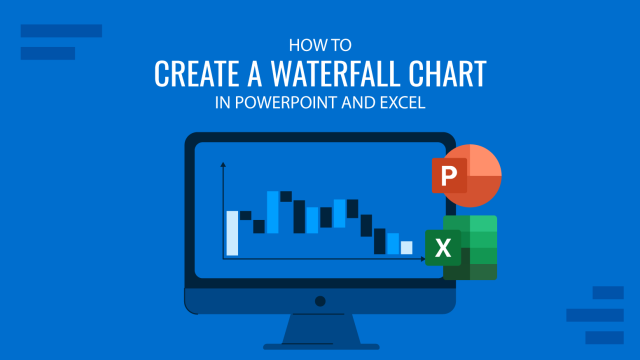
How To Create a Waterfall Chart in PowerPoint and Excel
What Is a Waterfall Chart? Waterfall Charts are a special representation of Stacked Bar Charts that resemble a waterfall due to its decreasing or increasing values moving from left to right. This kind of chart is usually used to describe cash flow fluctuations. The first bar describes the initial value of the flow (starting point). […]