Presentation slides with hierarchical data can be presented using various types of diagrams to create a logical flow of information. One diagram that is commonly used for this purpose is the tree diagram. This type of diagram has numerous applications, including decision-making, business strategy, educational presentations, and similar contexts.
In this tutorial, we will guide you through the process of creating a tree diagram in PowerPoint using PowerPoint templates. This method can help save time and ensure the final design aligns with the core subject, branding requirements, and provides visuals that are easy to explain during presentations.
What is a Tree Diagram and How is it Used in PowerPoint Presentations?
A tree diagram is a visual representation presented in the form of an illustration that appears to branch out from a single point towards multiple outcomes. It’s commonly used to represent important information during a PowerPoint presentation, such as a strategic decision path, organizational structure, cause-effect analysis, or a classification system.
Unlike simple bullet points or tables, tree diagrams guide the audience through a step-by-step, logical flow, making complex information easier to digest by breaking it down into branches that stem from a root. This makes it easier for the presenter to visually represent complex topics by breaking them down into smaller segments, showing the flow of information.
How to Draw a Tree Diagram in PowerPoint
You can draw a tree diagram in PowerPoint by using shapes and connectors to illustrate the link between information.
Start by opening a PowerPoint document, going to the Insert tab, then select Shapes. We’ll start with a rectangular shape.
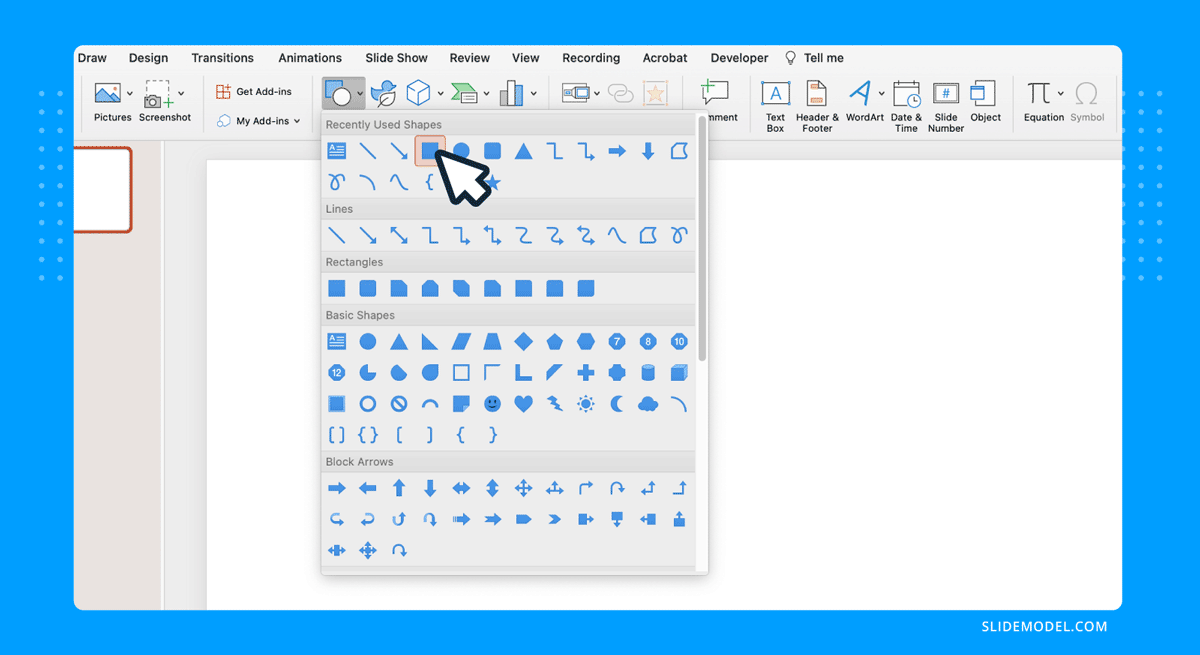
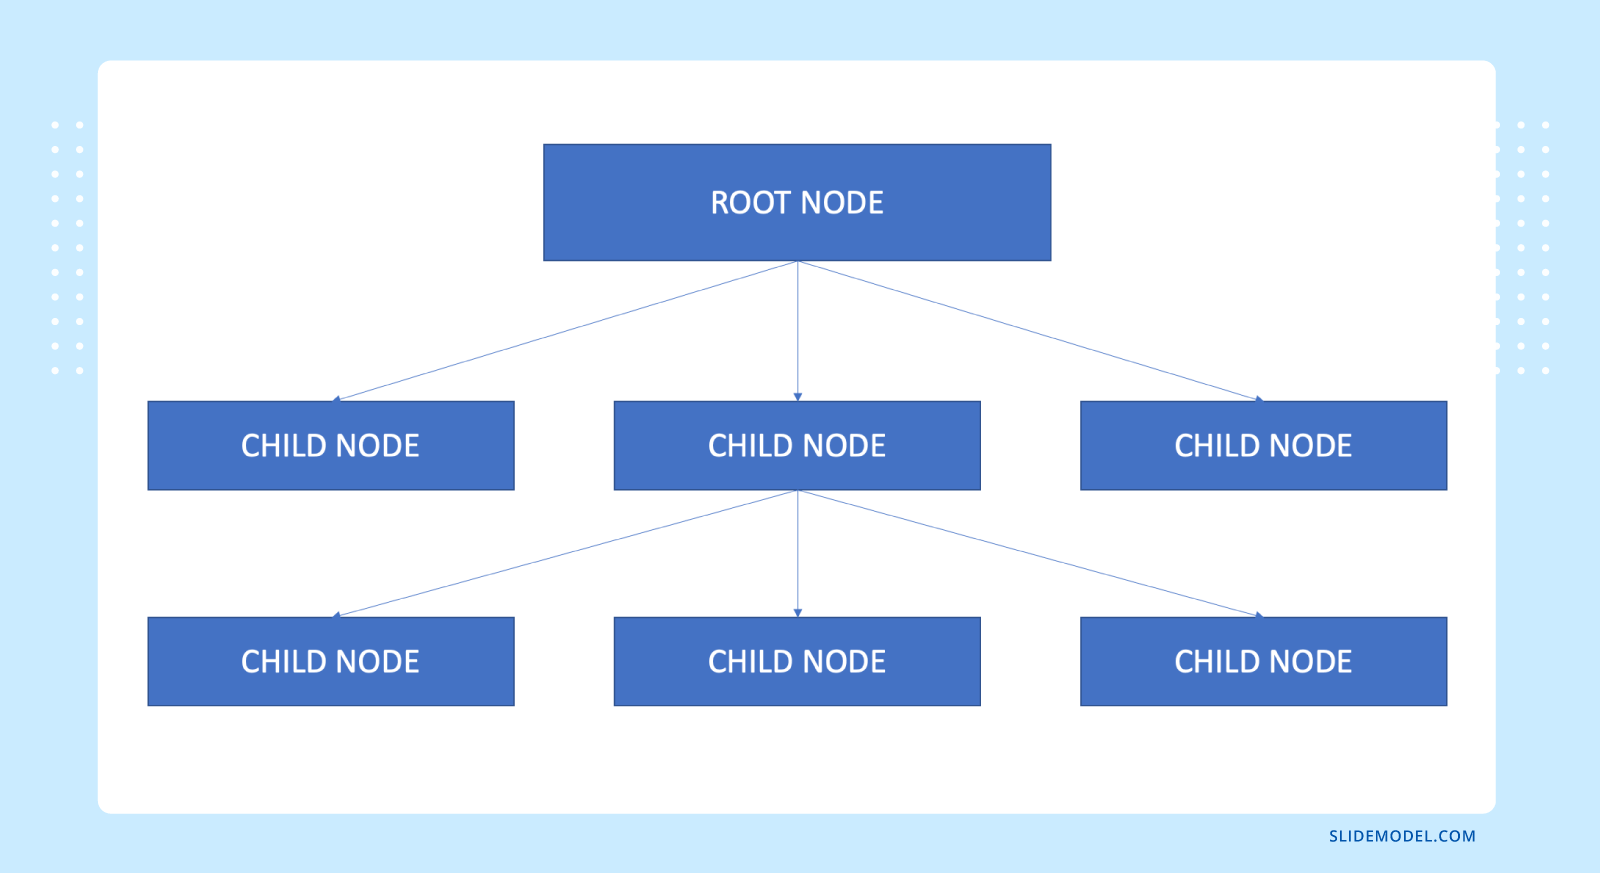
Click and drag in your blank slide to draw the Root Node of your PowerPoint tree diagram. Add a text box inside the rectangular shape with your desired text.

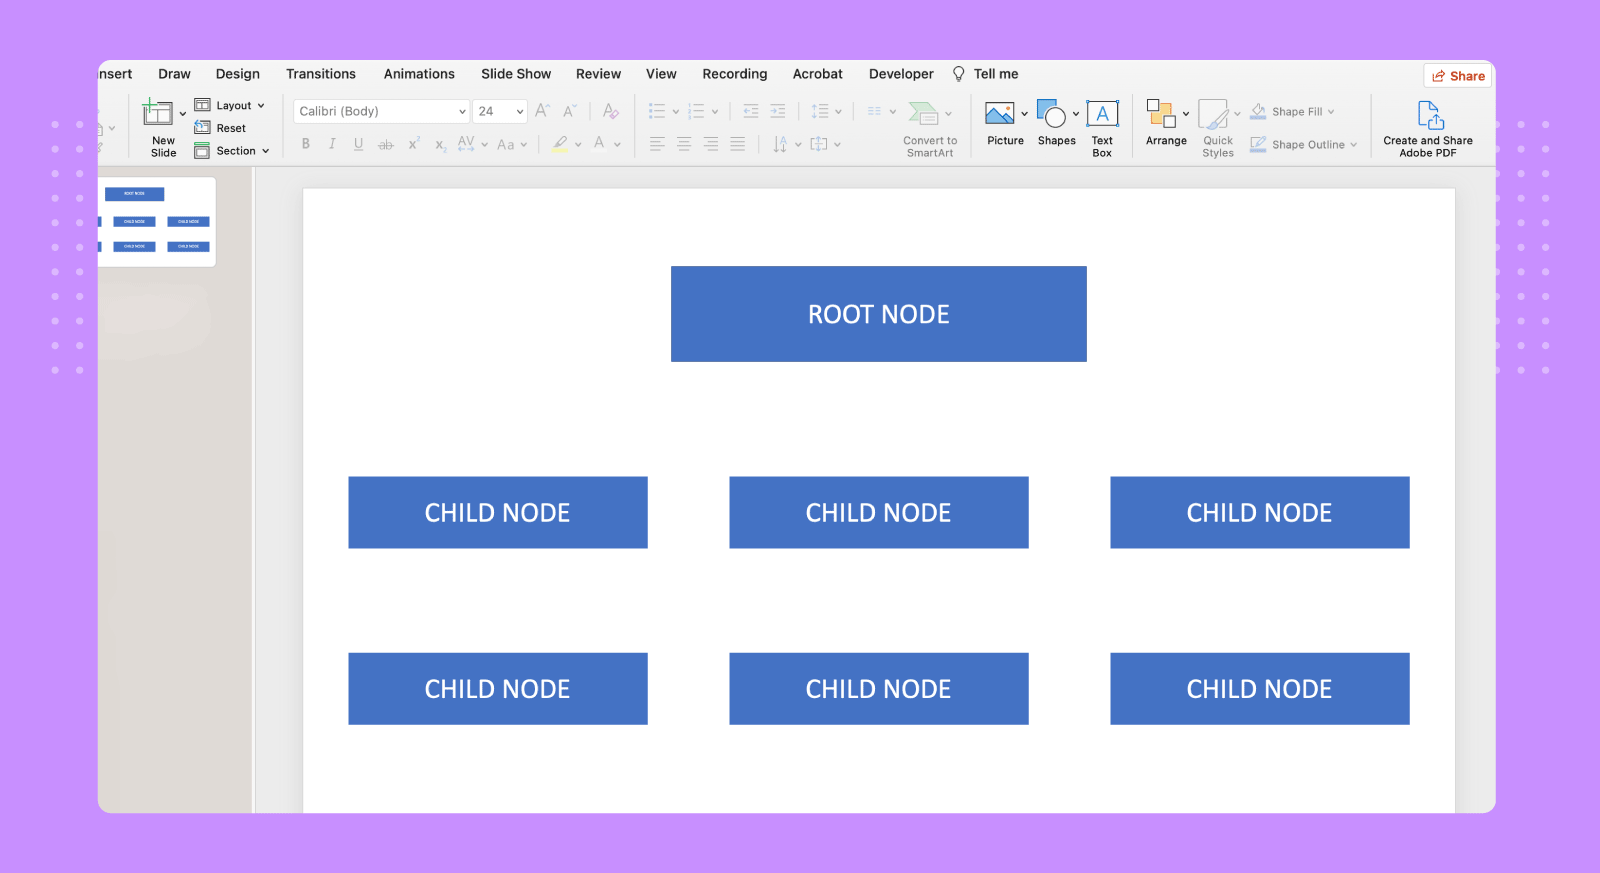
Repeat the same procedure to create all other nodes in their proper position. Overall, it should look like this image below.
Now it’s time to add the connector lines. Go to Insert > Shapes and select the line.
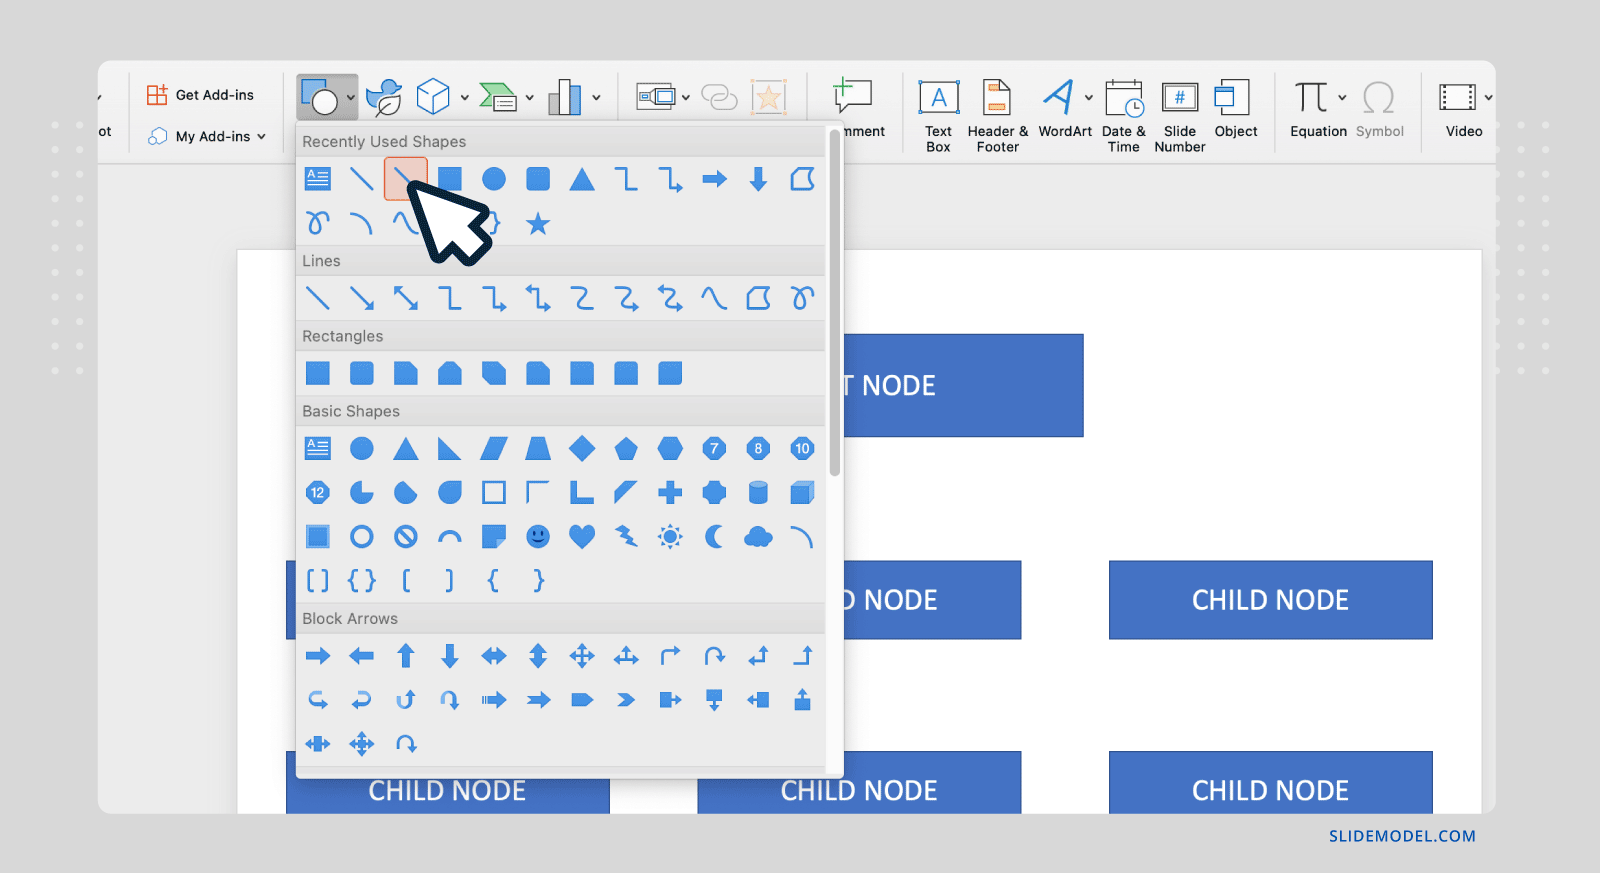
From one of its nodes, best if the center one, drag the line shape until you connect with the other shape’s node.
And this is the end result, where all nodes are interconnected according to their hierarchy and dependencies.
Examples of Tree Diagram Templates and Their Use
Other than the decision tree template mentioned above, here is a selection of a few tree diagram templates and their possible application in PowerPoint presentations. These are expandable PowerPoint tree diagram templates that are fully editable and can be customized for various topics. And for those of you wondering how to insert a tree diagram in PowerPoint, the fully editable slides in the templates mentioned below can be copied to other presentation decks.
Awesome Tree Diagram Template for PowerPoint
This is a tree diagram template featuring an innovative design that goes beyond basic shapes. The template mentioned below can be used to create tree diagrams for various business and digital technology topics, as well as to illustrate processes and systems. With editable slide elements, you can add text to placeholders and optionally replace icons to create custom tree diagrams.

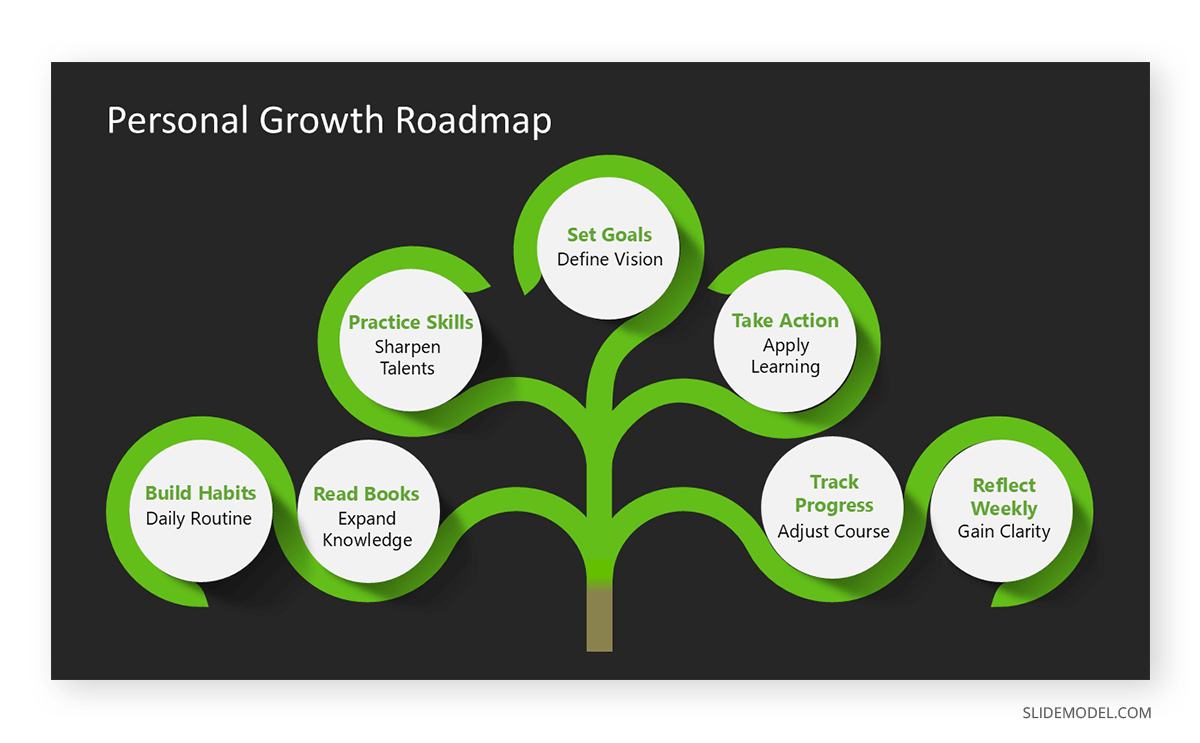
7-Step Tree Diagram Infographic Template for PowerPoint
This is a seven-step tree diagram template with a unique design that can help your diagram stand out. Using the seven steps, starting from the top, you can design a vertical tree diagram. The template comes with two identical slides with a light and dark version.
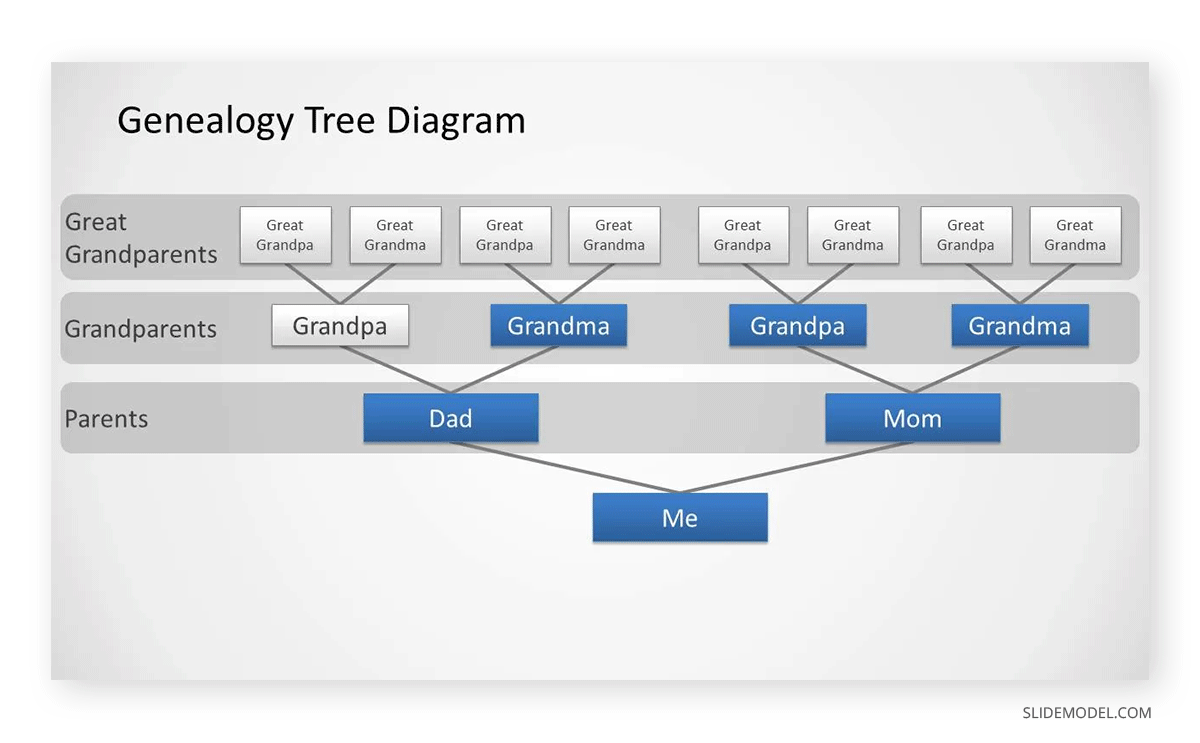
Genealogy Tree Diagram for PowerPoint
This is a hierarchy-themed tree diagram that can be used to create family trees, organizational charts, and even decision trees. You can expand the hierarchy by copying shapes and connectors to expand the diagram or remove elements to shrink it. The slide below depicts a sample genealogy diagram. The template has three slides, with two color-coded variations and a slide with blank placeholders.
Tips for Making Better Tree Diagrams in PowerPoint
When making tree diagrams in PowerPoint, you should consider a number of key factors that can help make the diagram easy to present and prevent potential issues.
1. Use consistent iconography and color cues: Assign a distinct color or icon to each category or decision type in your diagram. This helps the viewer quickly associate similar nodes across different branches without rereading each one.
2. Keep node content short and purposeful: Avoid packing too much information into each shape. Limit text to a few words or one precise phrase that captures the essence of that step. This keeps your diagram readable even when printed or viewed on smaller screens. While color and style are useful for emphasis, excessive use of gradients, shadows, or animations can clutter the diagram. Aim for clarity over adding more visual elements.
3. Maintain visual symmetry: Distribute nodes and connectors evenly to prevent visual imbalance. If one branch appears too crowded or dominant, adjust the spacing or split the content across multiple slides to maintain the flow. Otherwise, your diagram can seem cluttered and difficult to read for the audience.
4. Highlight active branches: When presenting a diagram step by step, dim or gray out inactive parts of the diagram to keep attention on the current branch. This is especially effective when walking through processes during a presentation. You can also use the Zoom tool in PowerPoint to highlight key sections. Additionally, you can also annotate slides during your presentation using the Pen tool in PowerPoint or use the Laser Pointer tool to direct your audience towards a slide element.
5. Test your layout on different devices: A tree diagram that looks great on a desktop might feel cramped on a projector or mobile screen. Review how your slides appear in various formats to ensure readability in different settings. Some slides can have compatibility issues when tested for the responsiveness of the slide design. Therefore, it’s best to review the slides on mobile and large screens to ensure that the content on your slides appears correctly when loaded on a large screen or via a projector.
Final Words
Tree diagrams in PowerPoint bring structure and clarity to complex content. They don’t just present information; they organize it in a way that encourages logical progression and better comprehension. Tree diagrams in PowerPoint bring structure and clarity to complex content.
By using SlideModel’s professionally designed templates, you can focus more on your message and less on manual formatting. Customizing these diagrams is straightforward. You can adjust labels, colors, and connectors with PowerPoint’s built-in tools. Furthermore, you can tailor your tree diagram for printouts, live presentations, or online training modules. As your message evolves, so can your visual structure. You can start small, with one or two branches, and expand as the conversation deepens, allowing your audience to follow along without feeling overwhelmed.