Data Visualization PowerPoint Slide
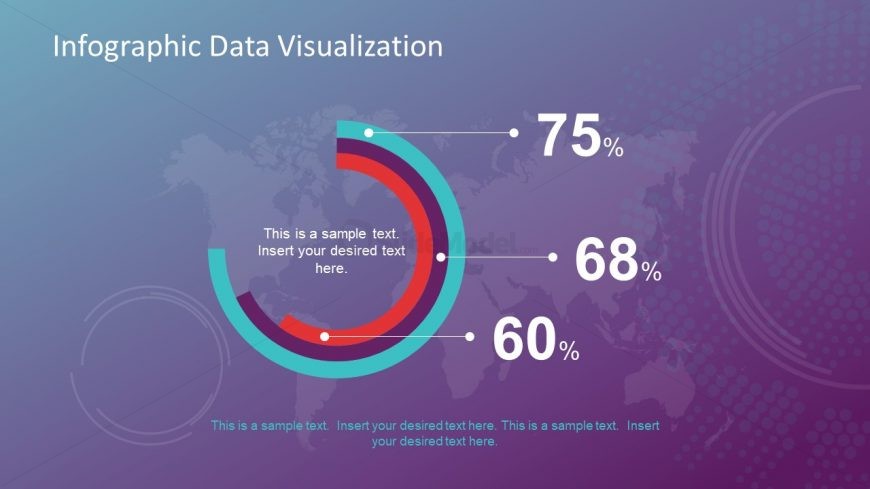
The free Data Visualization PowerPoint Slide template is an amazing dashboard style infographic presentation. This is a three-level circular template in the crescent shape which helps present three different data variables. For example, show the statistical analysis of sales or revenue generation for multiple products. Also, create the PowerPoint to represent various key performance indicators to evaluate the employee’s growth in the organization. This free PowerPoint has an incredible background of map and data visualization shapes. Also, the gradient effect of blue and plum makes gives the idea of modern technology and science fiction.
Return to Infographic Data Visualization Slide Free.