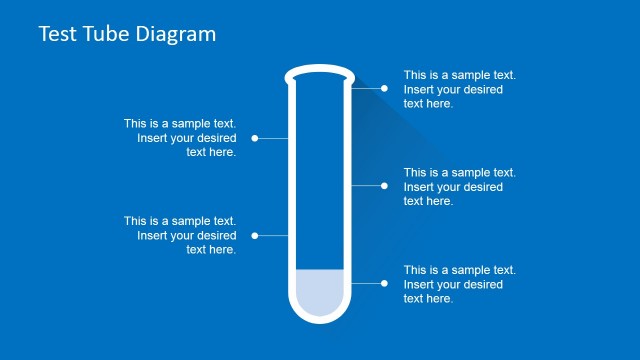
Slide 1 of 2 from Free Test Tube Diagram PowerPoint Concept
Free Test Tube Diagram PowerPoint Concept
Test Tube Diagram Concept for Presentations
- Diagram
- Segmented Wheel
- Concept Explanation Slide
- 16:9
- 100% Editable
The Test Tube Diagram Concept slide from the Free Test Tube Diagram PowerPoint Concept template offers a clear visual breakdown of segmented elements using editable shapes and vector icons. Ideal for scientific presentations and educational content, this slide layout supports effective communication of process components or product features within a business presentation or pitch deck template.
What’s on This Slide
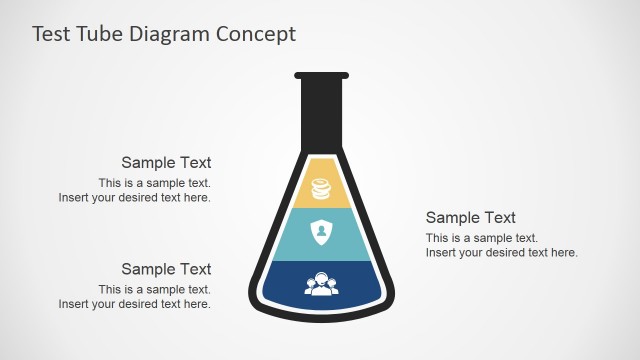
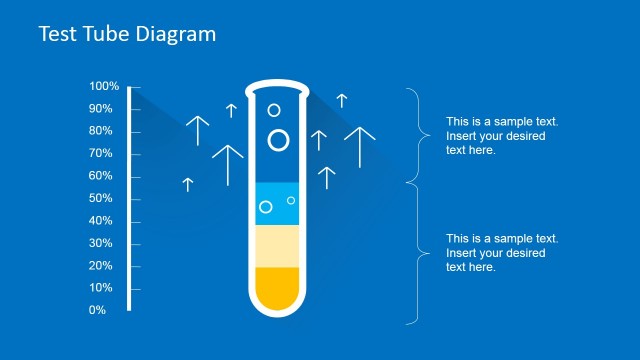
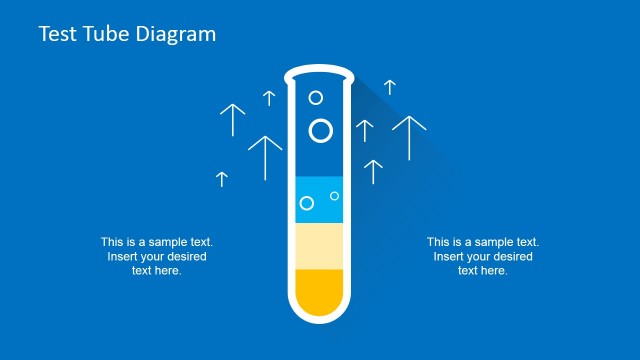
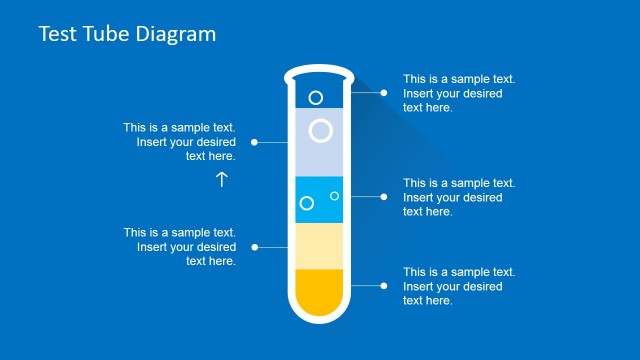
The slide features a central test tube graphic, vertically oriented, with four colored segments representing different elements. The segments are labeled with percentage values, each corresponding to a specific color: yellow, green, blue, and purple. Arrows extend from the left and right sides of the test tube, each containing an icon and a text placeholder. The title is positioned at the top left, while text placeholders are aligned below each arrow. The background is a gradient blue, enhancing the visual hierarchy and focus on the test tube.
How to Use It
This layout serves as a visual representation of components or elements in a process, making it suitable for scientific presentations or educational contexts. It fits well after an introduction or problem statement, providing a clear breakdown of elements. Use this slide to illustrate proportions or contributions of different factors in a project, experiment, or analysis. It can also be adapted for marketing presentations to show product features or benefits in a segmented manner.
Text Placeholders & Capacity
Keep your copy within these limits so it fits without resizing. Node labels can accommodate around 20 characters each.
| Placeholder | Count | Max characters (approx.) |
|---|---|---|
| Slide title | 1 | 30 |
| Item heading | 4 | 20 |
| Item body | 4 | 50 |
Slide Keywords
Download unlimited PowerPoint templates, charts and graphics for your presentations with our annual plan.
DOWNLOADReturn to Free Test Tube Diagram PowerPoint Concept.