Slide 16 of 26 from Free SWOT Infographics
Four Hexagons with Infographics PPT Template
SWOT Analysis Infographics for Presentations
- Diagram
- Matrix Quadrant
- Strategic Analysis Slide
- 16:9
- 100% Editable
What’s on This Slide
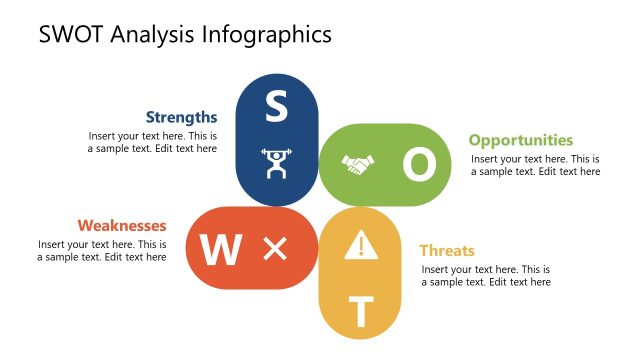
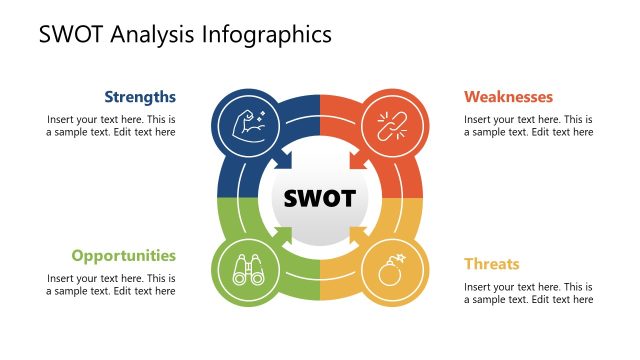
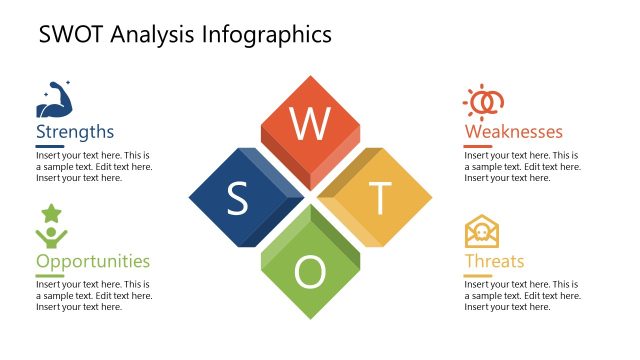
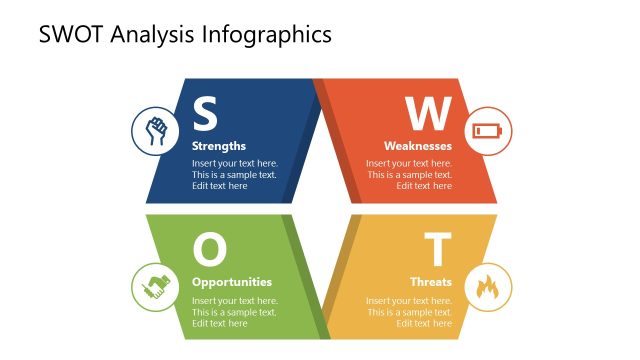
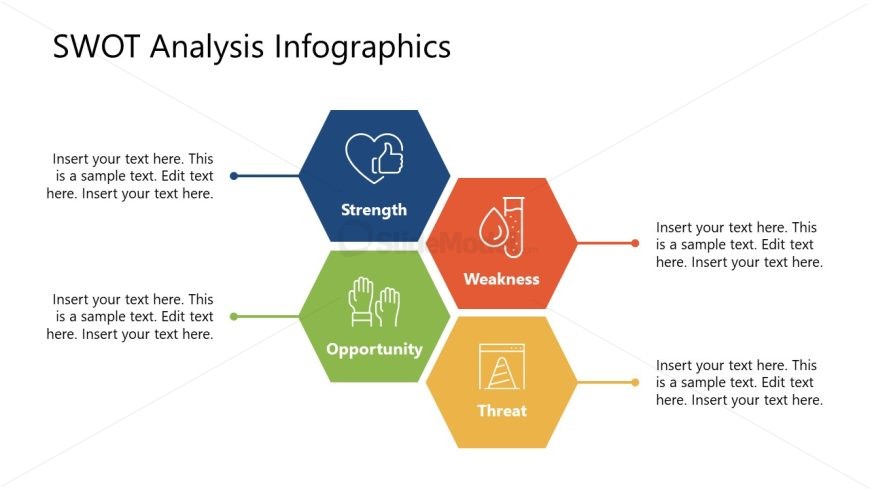
The layout features four hexagonal shapes arranged in a horizontal line, each representing a component of SWOT: Strength, Weakness, Opportunity, and Threat. Each hexagon contains an icon and a text placeholder for descriptions, with the icons positioned centrally within the hexagons. The hexagons vary in color: blue for Strength, orange for Weakness, green for Opportunity, and yellow for Threat. Text placeholders are aligned to the right of the hexagons, allowing for additional information. The overall composition is balanced, with a clear visual hierarchy emphasizing the hexagons and their labels.
How to Use It
This layout serves as a structured representation of a SWOT analysis, ideal for presenting strategic evaluations in business contexts. It fits well in a presentation sequence after problem identification and before strategic recommendations. Suitable scenarios include business planning sessions, marketing strategy discussions, and competitive analysis presentations. The clear segmentation of each SWOT component aids in conveying complex information succinctly, making it easier for audiences to grasp key insights.
Text Placeholders & Capacity
Keep your copy within these limits so it fits without resizing. Node body slots can accommodate roughly 15-20 words each.
| Placeholder | Count | Max characters (approx.) |
|---|---|---|
| Slide title | 1 | 40 |
| Item heading | 4 | 20 |
| Item body | 4 | 100 |
Slide Keywords
Download unlimited PowerPoint templates, charts and graphics for your presentations with our annual plan.
DOWNLOADReturn to Free SWOT Infographics.