Slide 10 of 15 from Free Sunset PowerPoint Background
Line Chart Slide with Labels – Free Sunset Background Template
Line Chart Visualization for Data Trends
- Chart
- Line Chart
- Evaluation Slide
- 16:9
- 100% Editable
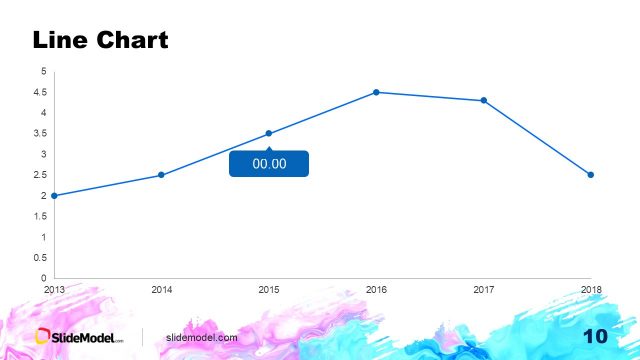
The Line Chart slide, part of the Free Sunset PowerPoint Background template, is designed for effective data visualization in business presentations. This layout is ideal for financial reports, market analysis, and performance tracking, showcasing trends over time with clarity. Featuring an orange line chart with data points and placeholders for titles, it enhances the storytelling aspect of your slide deck.
What’s on This Slide
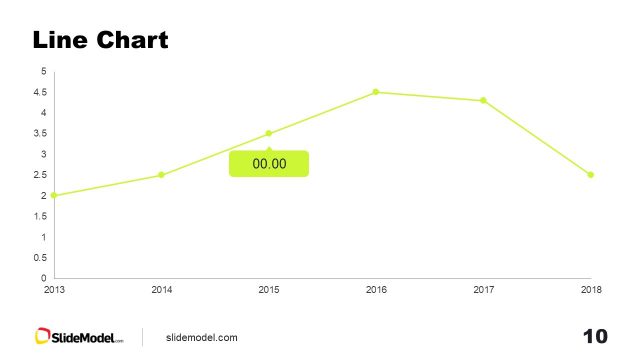
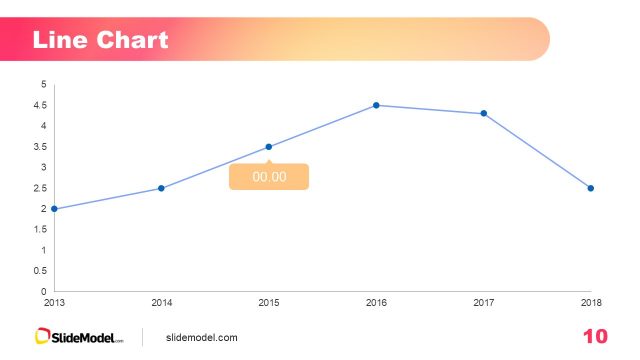
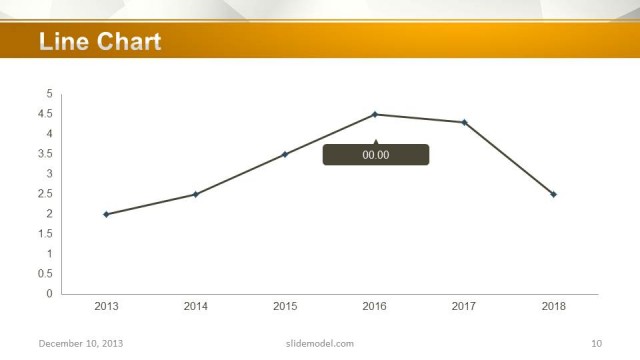
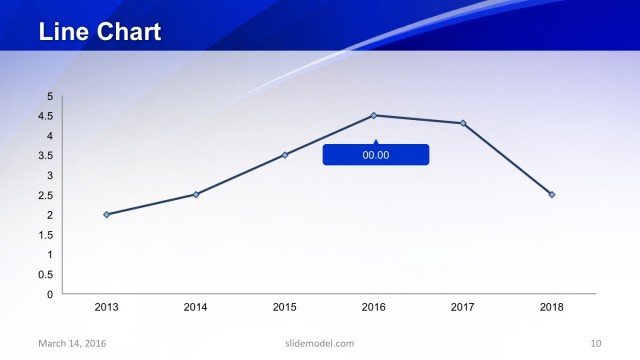
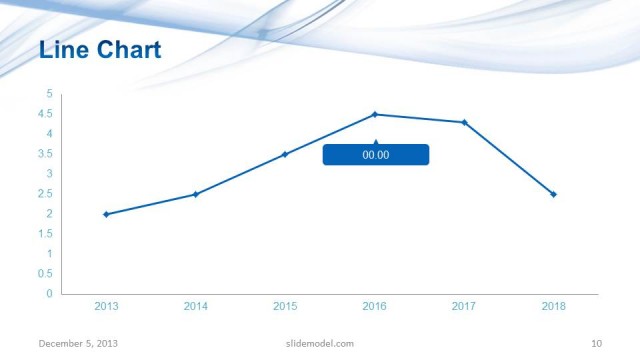
The slide features a line chart positioned centrally, depicting data trends over a timeline from 2013 to 2018. The vertical axis represents values ranging from 0 to 5, while the horizontal axis marks the years. The line is orange, with circular nodes indicating data points. One node has a label '00.00' in a yellow box, highlighting a specific value. Text placeholders are present for the chart title and axis labels, aligned at the top and bottom respectively. The background is white, enhancing the chart's visibility.
How to Use It
This layout serves as a data visualization tool, ideal for presenting trends over time in a business context. It fits well in a presentation sequence after introducing a problem or context, providing quantitative insights. This slide is useful for financial reports, performance tracking, or market analysis, where illustrating changes over time is essential. It can also be employed in project updates to show progress against targets.
Text Placeholders & Capacity
Keep your copy within these limits so it fits without resizing. Chart title and axis labels have limited character capacity.
| Placeholder | Count | Max characters (approx.) |
|---|---|---|
| Chart title | 1 | 20 |
| Axis label | 2 | 15 |
Slide Keywords
Download unlimited PowerPoint templates, charts and graphics for your presentations with our annual plan.
DOWNLOADReturn to Free Sunset PowerPoint Background.