Slide 10 of 15 from Free Gradient PowerPoint Background
Data Driven Line Chart for Gradient Background PowerPoint Template
Line Chart Visualization for Data Trends
- Chart
- Line Chart
- Data Findings Slide
- 16:9
- 100% Editable
What’s on This Slide
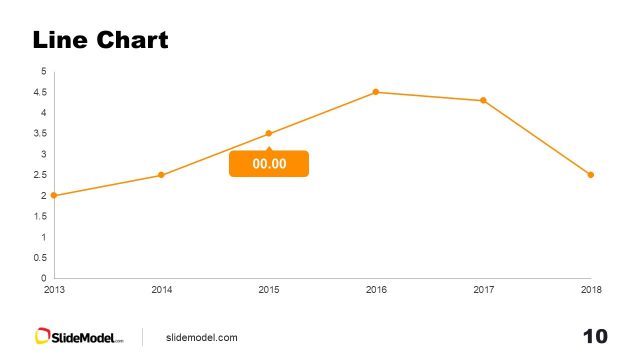
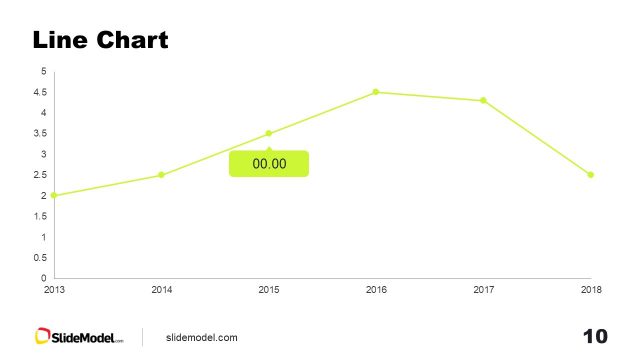
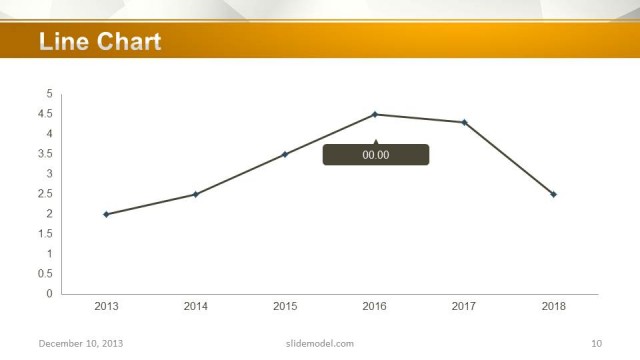
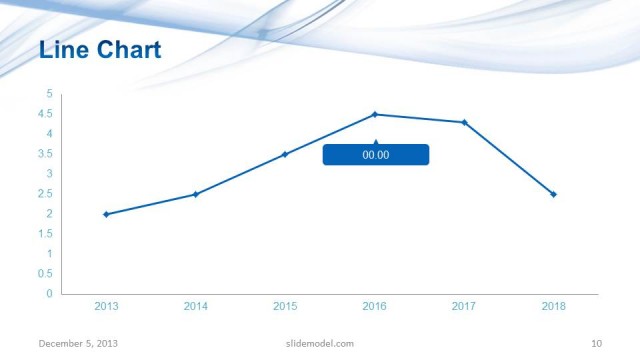
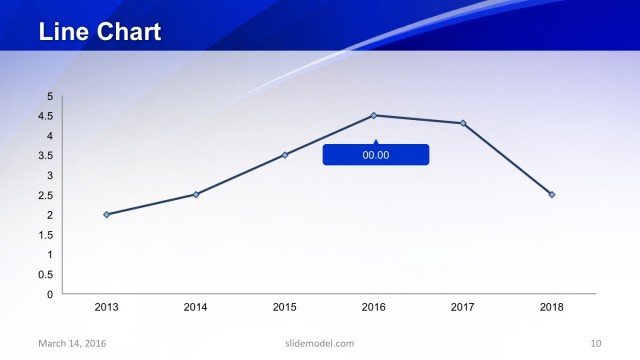
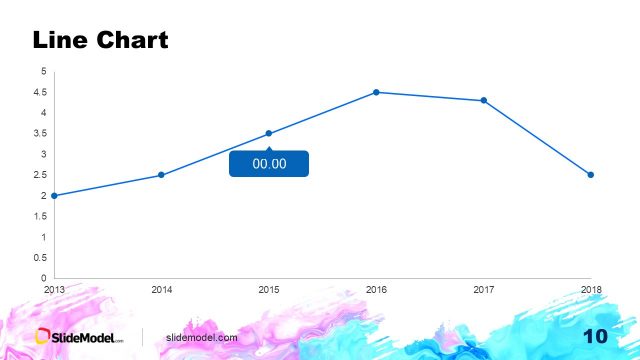
The slide features a line chart positioned centrally, displaying a trend over time from 2013 to 2018. The chart includes a horizontal axis labeled with years and a vertical axis indicating values ranging from 0 to 5. Data points are marked with blue circles connected by a light blue line. A label with the text '00.00' is placed above one of the data points, highlighting a specific value. The background features a gradient transitioning from pink to orange at the top, creating a visually distinct header area. The overall layout emphasizes the chart as the focal point.
How to Use It
This layout serves as a line chart visualization, ideal for presenting data trends over a specified period. It fits well in a presentation sequence after introducing relevant data or metrics. Use this slide to illustrate performance, growth, or changes in values over time, making it suitable for business reports, financial presentations, or project updates. It effectively conveys quantitative information in a clear and structured manner, aiding in data-driven discussions.
Text Placeholders & Capacity
Keep your copy within these limits so it fits without resizing. Node labels can accommodate short phrases, roughly 5 characters each.
| Placeholder | Count | Max characters (approx.) |
|---|---|---|
| Slide title | 1 | 20 |
| Item body | 7 | 5 |
| Chart title | 1 | 20 |
Slide Keywords
Download unlimited PowerPoint templates, charts and graphics for your presentations with our annual plan.
DOWNLOADReturn to Free Gradient PowerPoint Background.