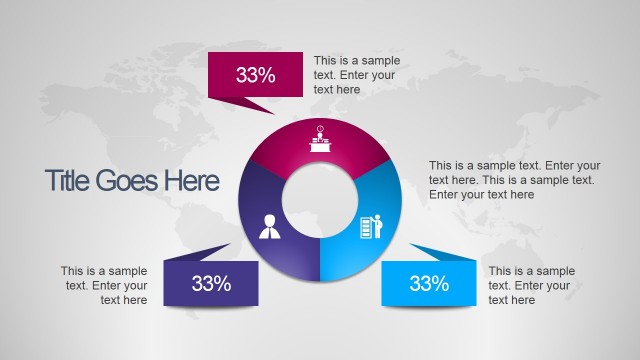
Slide 4 of 8 from Free Smart Chart PowerPoint Templates
Donut Chart PowerPoint Graphic Slides
Quarterly Performance Overview Chart
- Chart
- Donut Chart
- Evaluation Slide
- 16:9
- 100% Editable
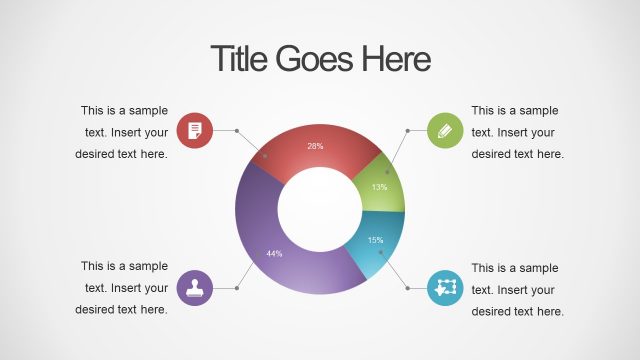
The Quarterly Performance Overview slide from the Free Smart Chart PowerPoint Templates offers a clear evaluation layout featuring a donut chart ideal for financial reviews and business performance analysis. This slide template supports detailed quarterly reports with editable shapes and text areas, making it suitable for corporate presentations and strategic planning. Its balanced design enhances data visualization within a professional slide deck.
What’s on This Slide
The layout features a central circular chart divided into four segments, each representing a quarter. The segments are color-coded and labeled with numerical values. Surrounding the chart are two rectangular areas on the left and right, each containing text placeholders for descriptions or insights. The left area is blue and the right area is purple, creating a balanced visual structure. The title placeholder is positioned at the top center, while the background is a light gradient. The overall composition emphasizes the central chart, with clear visual hierarchy.
How to Use It
This layout serves as a quarterly performance overview, ideal for presenting financial data or business metrics. It fits well in a presentation sequence after introductory slides, providing a detailed analysis of performance over time. Suitable for business reviews, financial reports, or strategic planning sessions, this structure allows for clear communication of key performance indicators. It can also be used for comparing quarterly results across different departments or projects, making it versatile for various business contexts.
Text Placeholders & Capacity
Keep your copy within these limits so it fits without resizing. Body slots can accommodate roughly 10-12 words each.
| Placeholder | Count | Max characters (approx.) |
|---|---|---|
| Slide title | 1 | 30 |
| Body paragraph | 4 | 50 |
Slide Keywords
Download unlimited PowerPoint templates, charts and graphics for your presentations with our annual plan.
DOWNLOADReturn to Free Smart Chart PowerPoint Templates.