Slide 1 of 2 from Free Sales Forecasting PowerPoint Template
Free Sales Forecasting PowerPoint Dashboard Slide Template
Sales Forecasting Slide Overview
- Text Layout
- Other
- Financial Summary Slide
- 16:9
- 100% Editable
What’s on This Slide
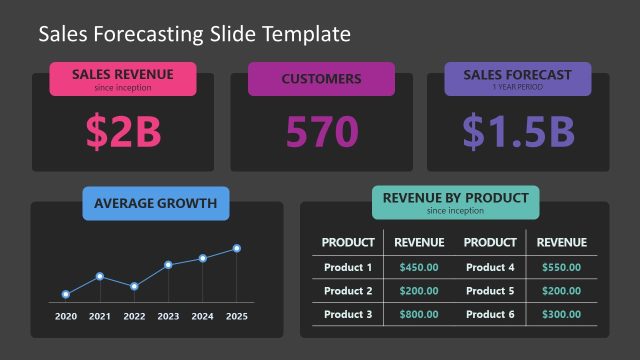
The slide features a structured layout with four main sections. At the top, three large rectangular boxes display key metrics: sales revenue, customer count, and sales forecast, each with distinct background colors. Below, a line chart illustrates average growth over the years 2020 to 2025, positioned centrally. To the right, a table outlines revenue by product, organized in two columns. Text placeholders exist for titles and metrics, aligned prominently. The overall composition is balanced, with a clear visual hierarchy emphasizing the metrics and growth trend.
How to Use It
This layout serves as a comprehensive overview of sales forecasting metrics, suitable for presenting key performance indicators in a business context. It fits well in a sequence after introductory slides, providing a snapshot of sales performance and projections. This structure is ideal for sales meetings, investor presentations, or quarterly reviews, where concise data representation is crucial. It can also be used for internal reporting to summarize sales achievements and forecasts effectively.
Text Placeholders & Capacity
Keep your copy within these limits so it fits without resizing. Node slots can accommodate concise metrics, roughly 2-3 words each.
| Placeholder | Count | Max characters (approx.) |
|---|---|---|
| Slide title | 1 | 30 |
| Item body | 6 | 15 |
| Item heading | 6 | 20 |
| Chart title | 1 | 20 |
| Column header | 2 | 10 |
Slide Keywords
Download unlimited PowerPoint templates, charts and graphics for your presentations with our annual plan.
DOWNLOADReturn to Free Sales Forecasting PowerPoint Template.