Slide 6 of 8 from Free Market Analysis Diagrams for PowerPoint
4 Steps Paper Fold Effect Diagrams Free PowerPoint Vectors
Wavy Process Diagram for Market Analysis
- Diagram
- Process Flow
- Process Slide
- 16:9
- 100% Editable
What’s on This Slide
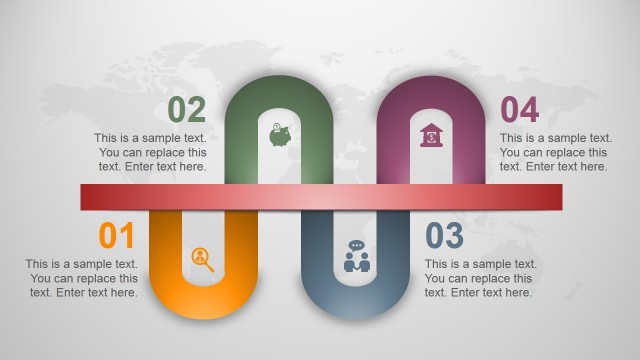
The layout features a wavy, zigzag design with four distinct segments. Each segment is colored differently, transitioning from blue to purple and finally to maroon. Numbered placeholders are positioned above each segment, aligned to the left. Below each segment, there are text placeholders for descriptions. Icons representing various concepts are integrated into the segments, enhancing visual interest. The overall composition is balanced, with a light background that allows the colors to stand out. The segments are evenly spaced, creating a rhythmic flow across the slide.
How to Use It
This layout serves as a sequential process diagram, ideal for illustrating steps in a market analysis or strategic planning context. It fits well after problem identification slides, guiding the audience through proposed solutions or actions. This structure is applicable for business presentations that require clarity in process explanation, making it suitable for project timelines, product development stages, or marketing strategies. The wavy design adds a dynamic visual element, keeping the audience engaged while conveying information effectively.
Text Placeholders & Capacity
Keep your copy within these limits so it fits without resizing. Text slots for node labels are tight, roughly 2 characters each, while body text can accommodate about 40 characters.
| Placeholder | Count | Max characters (approx.) |
|---|---|---|
| Item heading | 4 | 2 |
| Item body | 4 | 40 |
Slide Keywords
Download unlimited PowerPoint templates, charts and graphics for your presentations with our annual plan.
DOWNLOADReturn to Free Market Analysis Diagrams for PowerPoint.