Slide 6 of 8 from Free Infographic Flat PowerPoint Template
Chart in Infographic Slide Template
Process Flow with Pie Chart Slide
- Diagram
- Process Flow
- Process Slide
- 16:9
- 100% Editable
The Process Flow with Pie Chart slide from the Free Infographic Flat PowerPoint Template combines a clear process diagram with a segmented pie chart, ideal for business presentations and quarterly performance reviews. This layout uses editable shapes and vector icons to illustrate sequential stages alongside data visualization, making it suitable for project timelines and corporate presentations. The design supports effective communication of process steps and comparative metrics within a professional slide deck.
What’s on This Slide
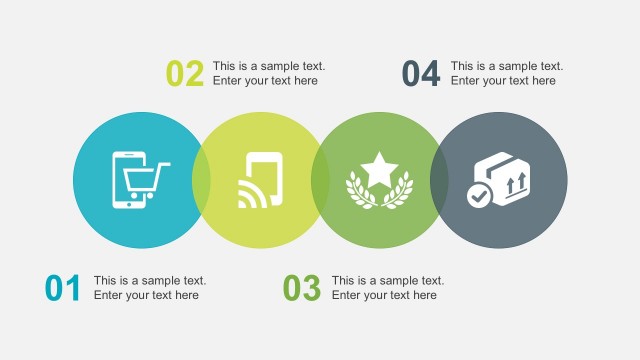
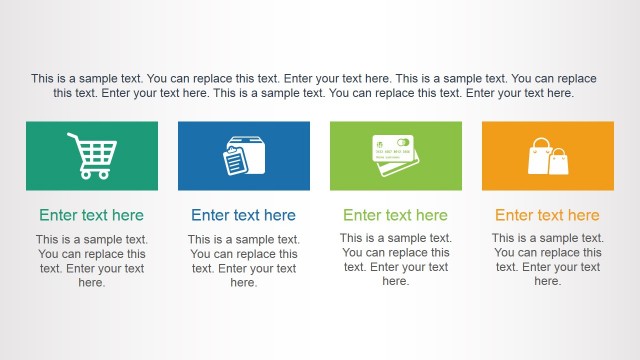
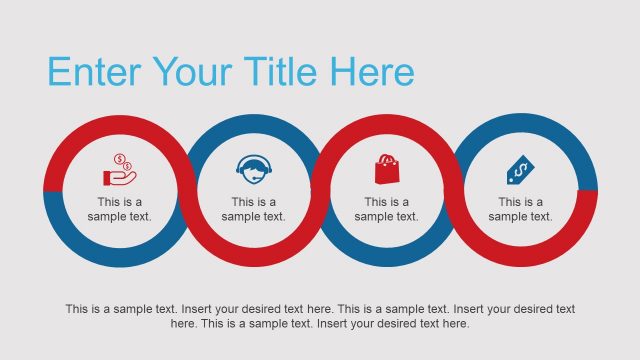
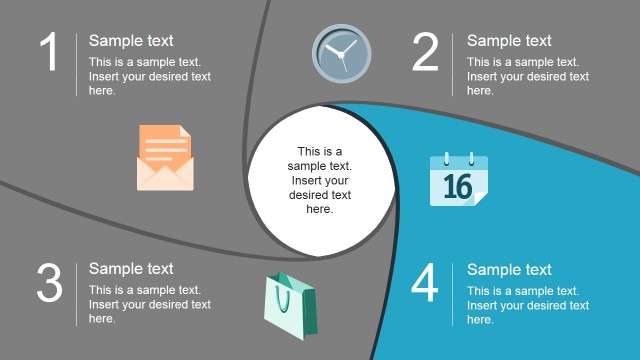
The layout features a vertical arrangement of circular icons on the left side, with a pie chart on the right. The icons represent different stages, each accompanied by text placeholders below them. The first icon is blue, followed by green, yellow, and orange icons, all of equal size. The pie chart displays multiple segments in varying colors, labeled with quarter indicators. Text placeholders are aligned centrally beneath each icon and at the bottom of the pie chart. The background is a light gradient, enhancing the visual separation of elements.
How to Use It
This layout serves as a process flow diagram combined with a pie chart for data representation. It fits well in presentations discussing business processes, performance metrics, or project timelines. The sequential arrangement of icons allows for clear communication of steps or phases, while the pie chart effectively visualizes data distribution. This structure is useful for showcasing quarterly results or comparing different business metrics in a visually engaging manner.
Text Placeholders & Capacity
Keep your copy within these limits so it fits without resizing. Text slots can accommodate concise entries, roughly 5-10 words each.
| Placeholder | Count | Max characters (approx.) |
|---|---|---|
| Item heading | 5 | 30 |
| Item body | 5 | 50 |
| Chart title | 1 | 30 |
| Body paragraph | 1 | 100 |
Slide Keywords
Download unlimited PowerPoint templates, charts and graphics for your presentations with our annual plan.
DOWNLOADReturn to Free Infographic Flat PowerPoint Template.