Slide 4 of 8 from Free Flat Elements for PowerPoint Infographics
Creative PowerPoint Shapes with Placeholders
Data Representation with Icons - Free Template
- Diagram
- Other
- Evaluation Slide
- 16:9
- 100% Editable
The Data Representation with Icons slide from the Free Flat Elements for PowerPoint Infographics template offers a clear layout to present key metrics and performance indicators. This slide layout uses editable shapes and vector icons to highlight statistics effectively, making it suitable for business presentations and pitch deck templates that require concise data visualization.
What’s on This Slide
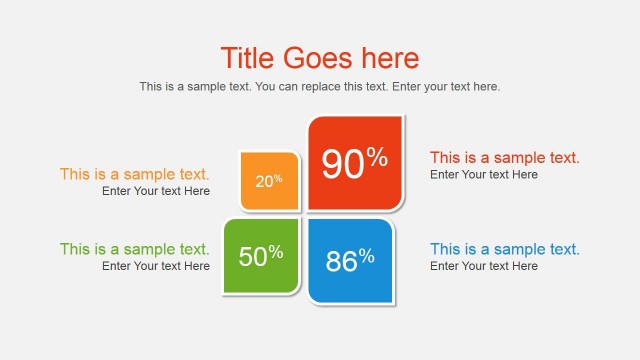
The layout features three distinct shapes arranged horizontally, each containing a number and a text placeholder. The left shape is a red drop, the center is a gray oval, and the right is a blue rounded rectangle. Each shape has a number prominently displayed at the top, with a sample text placeholder below it. The title is centered above the shapes, using a larger font size for emphasis. The background is white, providing contrast to the colored shapes, which are visually separated yet aligned to create a cohesive look. The overall composition is balanced and straightforward.
How to Use It
This layout serves as a data representation tool, ideal for showcasing key metrics or statistics in a business context. It fits well in a presentation sequence after problem identification, providing a clear visual summary of important figures. Scenarios include performance metrics, sales figures, or survey results. The design allows for easy comparison among the three data points, making it effective for highlighting trends or achievements in a concise manner.
Text Placeholders & Capacity
Keep your copy within these limits so it fits without resizing. Node labels can hold about 10 characters each, while body text can accommodate around 30 characters.
| Placeholder | Count | Max characters (approx.) |
|---|---|---|
| Slide title | 1 | 30 |
| Item heading | 3 | 10 |
| Item body | 3 | 30 |
Slide Keywords
Download unlimited PowerPoint templates, charts and graphics for your presentations with our annual plan.
DOWNLOAD